European Session Crude Oil Report — 09 Oct 2026
QuoteReporter
WTI hovers near $90.86 in early European trade, down 0.27% on the session as the contract extends its seven-day decline to 3.96%, while Brent firms to $103.02 with a modest 0.75% gain, paring weekly losses to 3.36%. The Brent-WTI spread holds at $12.16, testing the upper bound of its three-month range as European refiners weigh heavy Atlantic Basin sour crude availability against tightening Middle East medium grades. Asian overnight action sees WTI trapped in a $90.12-$91.45 band with light volumes, failing to challenge the 50-day EMA at $90.23 despite oversold RSI(14) readings at 22.5.
Technicals paint a divergent picture. WTI remains under pressure beneath all key moving averages, with the 9-day EMA at $92.34 capping rebounds and the 21-day EMA at $92.90 reinforcing resistance. Brent, however, clings to its 9-day EMA at $103.07 and rides support from the 21-day EMA at $101.63, with RSI(14) at 38.9 showing marginally more room for recovery. The pivot point framework suggests WTI battles between PP at $89.46 and S1 at $72.17, while Brent defends PP at $96.17 with R1 at $117.04 looming above. Both benchmarks maintain steep backwardation—WTI’s Oct26-Jul27 spread at -10.8% and Brent’s at -14.6%—signaling persistent near-term physical tightness despite macroeconomic headwinds.

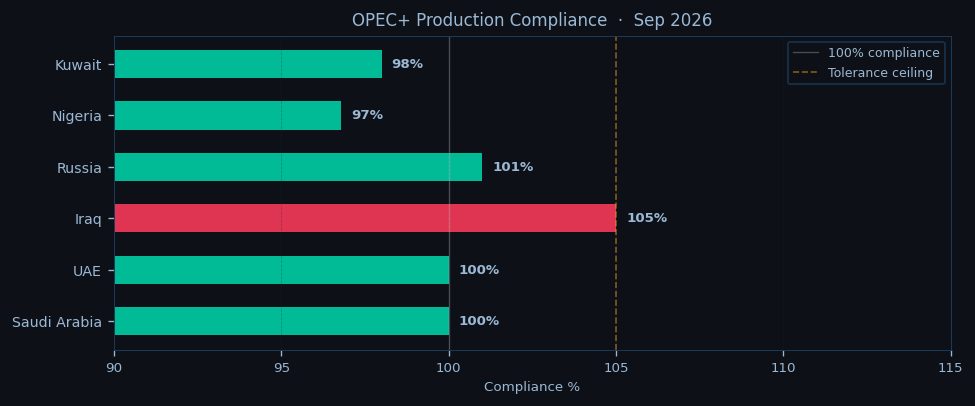
Geopolitical tensions inject volatility. The Strait of Hormuz remains elevated as IRGC naval activity disrupts tanker flows, threatening 20 million bbl/d of transit. Bab-el-Mandeb sees VLCCs diverting via the Cape of Good Hope amid Houthi attacks, adding seven days to voyages and tightening Atlantic Basin freight rates. These disruptions offset recovering Suez Canal flows and stable Malacca transit, keeping a bid under Brent relative to WTI. OPEC+ discipline underpins the market, with the group maintaining cuts through December 2026 and Saudi Arabia adhering strictly to quotas, though Iraq and Russia continue to produce slightly above targets. The call on OPEC at 27.4 mb/d versus 26.8 mb/d output leaves a 0.6 mb/d deficit, compounding inventory draws.
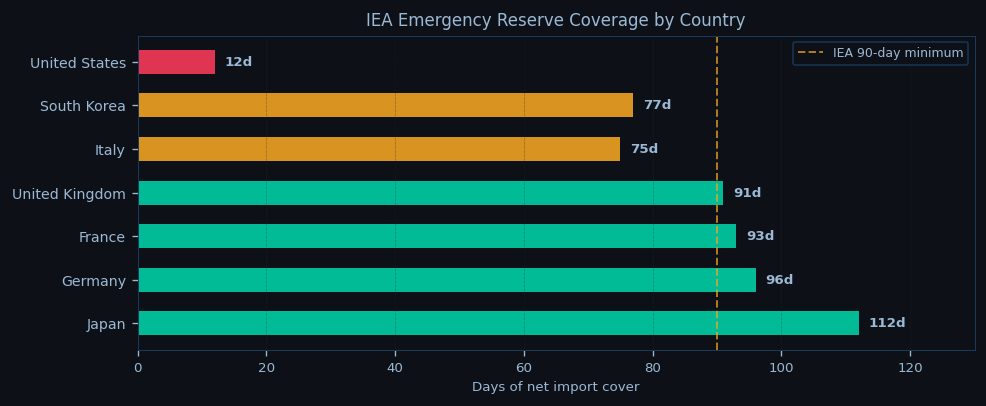
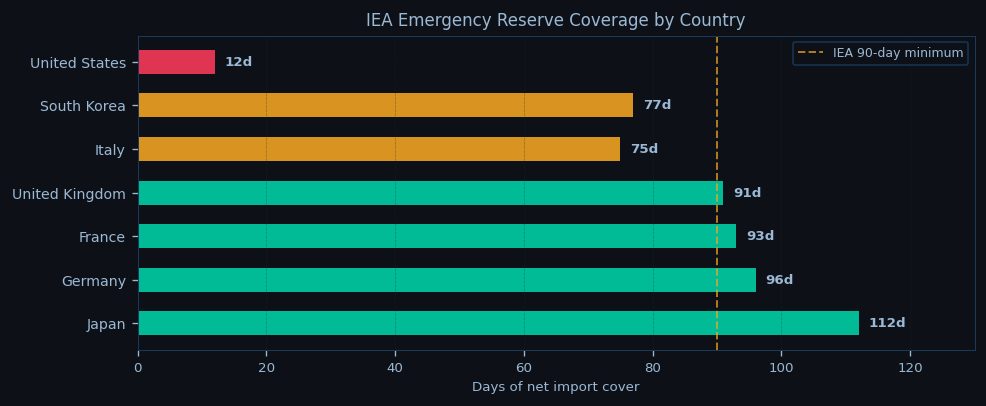
Term structure signals near-term scarcity. WTI’s prompt month trades at $90.21 versus $80.50 for Jul27, while Brent’s front-month at $101.80 contrasts with $86.89 for back-month delivery. The steeper backwardation in Brent reflects stronger European refinery demand and Middle East supply risks. US inventory dynamics show commercial stocks at 427.3 mb, up 0.9 mb WoW, with Cushing hub levels at 24.3 mb and SPR holdings at 283.8 mb (39.7% capacity). Domestic production edges up to 13.95 mb/d, but refinery runs at 92.5% utilization indicate robust demand.
The session’s focus shifts to the NYMEX open at 14:30 CET, with traders eyeing whether WTI can defend $90 amid weak technical momentum. Brent’s relative strength may face tests if the spread to WTI stretches beyond $12.50, a level that could trigger European refinery hedging. Downside risks persist given WTI’s oversold condition and Brent’s struggle to reclaim its 50-day EMA, but geopolitical friction and OPEC+ discipline limit bearish momentum. Key levels to watch include WTI’s PP at $89.46—a breach here opens the path to S1 at $72.17—while Brent must hold above $101.63 (21-day EMA) to sustain its rebound attempt. The crude complex remains caught between physical tightness and recession fears, with chokepoint disruptions and EIA data (if Wednesday) likely to dictate near-term direction.

Disclaimer
The content on MarketsFN.com is provided for educational and informational purposes only. It does not constitute financial advice, investment recommendations, or trading guidance. All investments involve risks, and past performance does not guarantee future results. You are solely responsible for your investment decisions and should conduct independent research and consult a qualified financial advisor before acting. MarketsFN.com and its authors are not liable for any losses or damages arising from your use of this information.
Related Articles
- US Session Crude Oil Report — 08 Oct 2026 — WTI crude is trading at $90.86 in early US session action, holding just above the pivotal $89.46 level as the contract…
- Indonesian Nickel Quake Spurs Price Surge — Earthquake in the Indonesian Nickel Belt: A Potential Supply Chain Disruption On October 8, 2026, a magnitude 5.0…
- European Session Crude Oil Report — 08 Oct 2026 — Crude oil markets edge lower in European trading as WTI tests the $90.50 support level while Brent struggles to hold…
- US Session Crude Oil Report — 07 Oct 2026 — WTI crude is trading at $90.86 in the US session, down 0.27% on the day as it struggles to hold above the…
- India Earthquake Shakes Wheat/Rice Prices — Earthquake in Indian Wheat/Rice Belt: A Potential Catalyst for Asian Food Prices On October 6, 2026, a magnitude 5.1…