GBP/USD: Up 0.06% to 1.3637 — RSI Signals Overbought
MarketsFN Team
GBP/USD: Up 0.06% to 1.3637 — RSI Signals Overbought
Published: August 25, 2026 · MarketsFN Team
| Pair | Rate | Change | RSI(14) | SMA-20 | SMA-50 | 52W High | 52W Low | Pivot | R1 | S1 |
|---|---|---|---|---|---|---|---|---|---|---|
| GBP/USD | 1.3637 | +0.06% | 79.7 | 1.3504 | 1.3400 | 1.3654 | 1.3167 | 1.3645 | 1.3666 | 1.3633 |
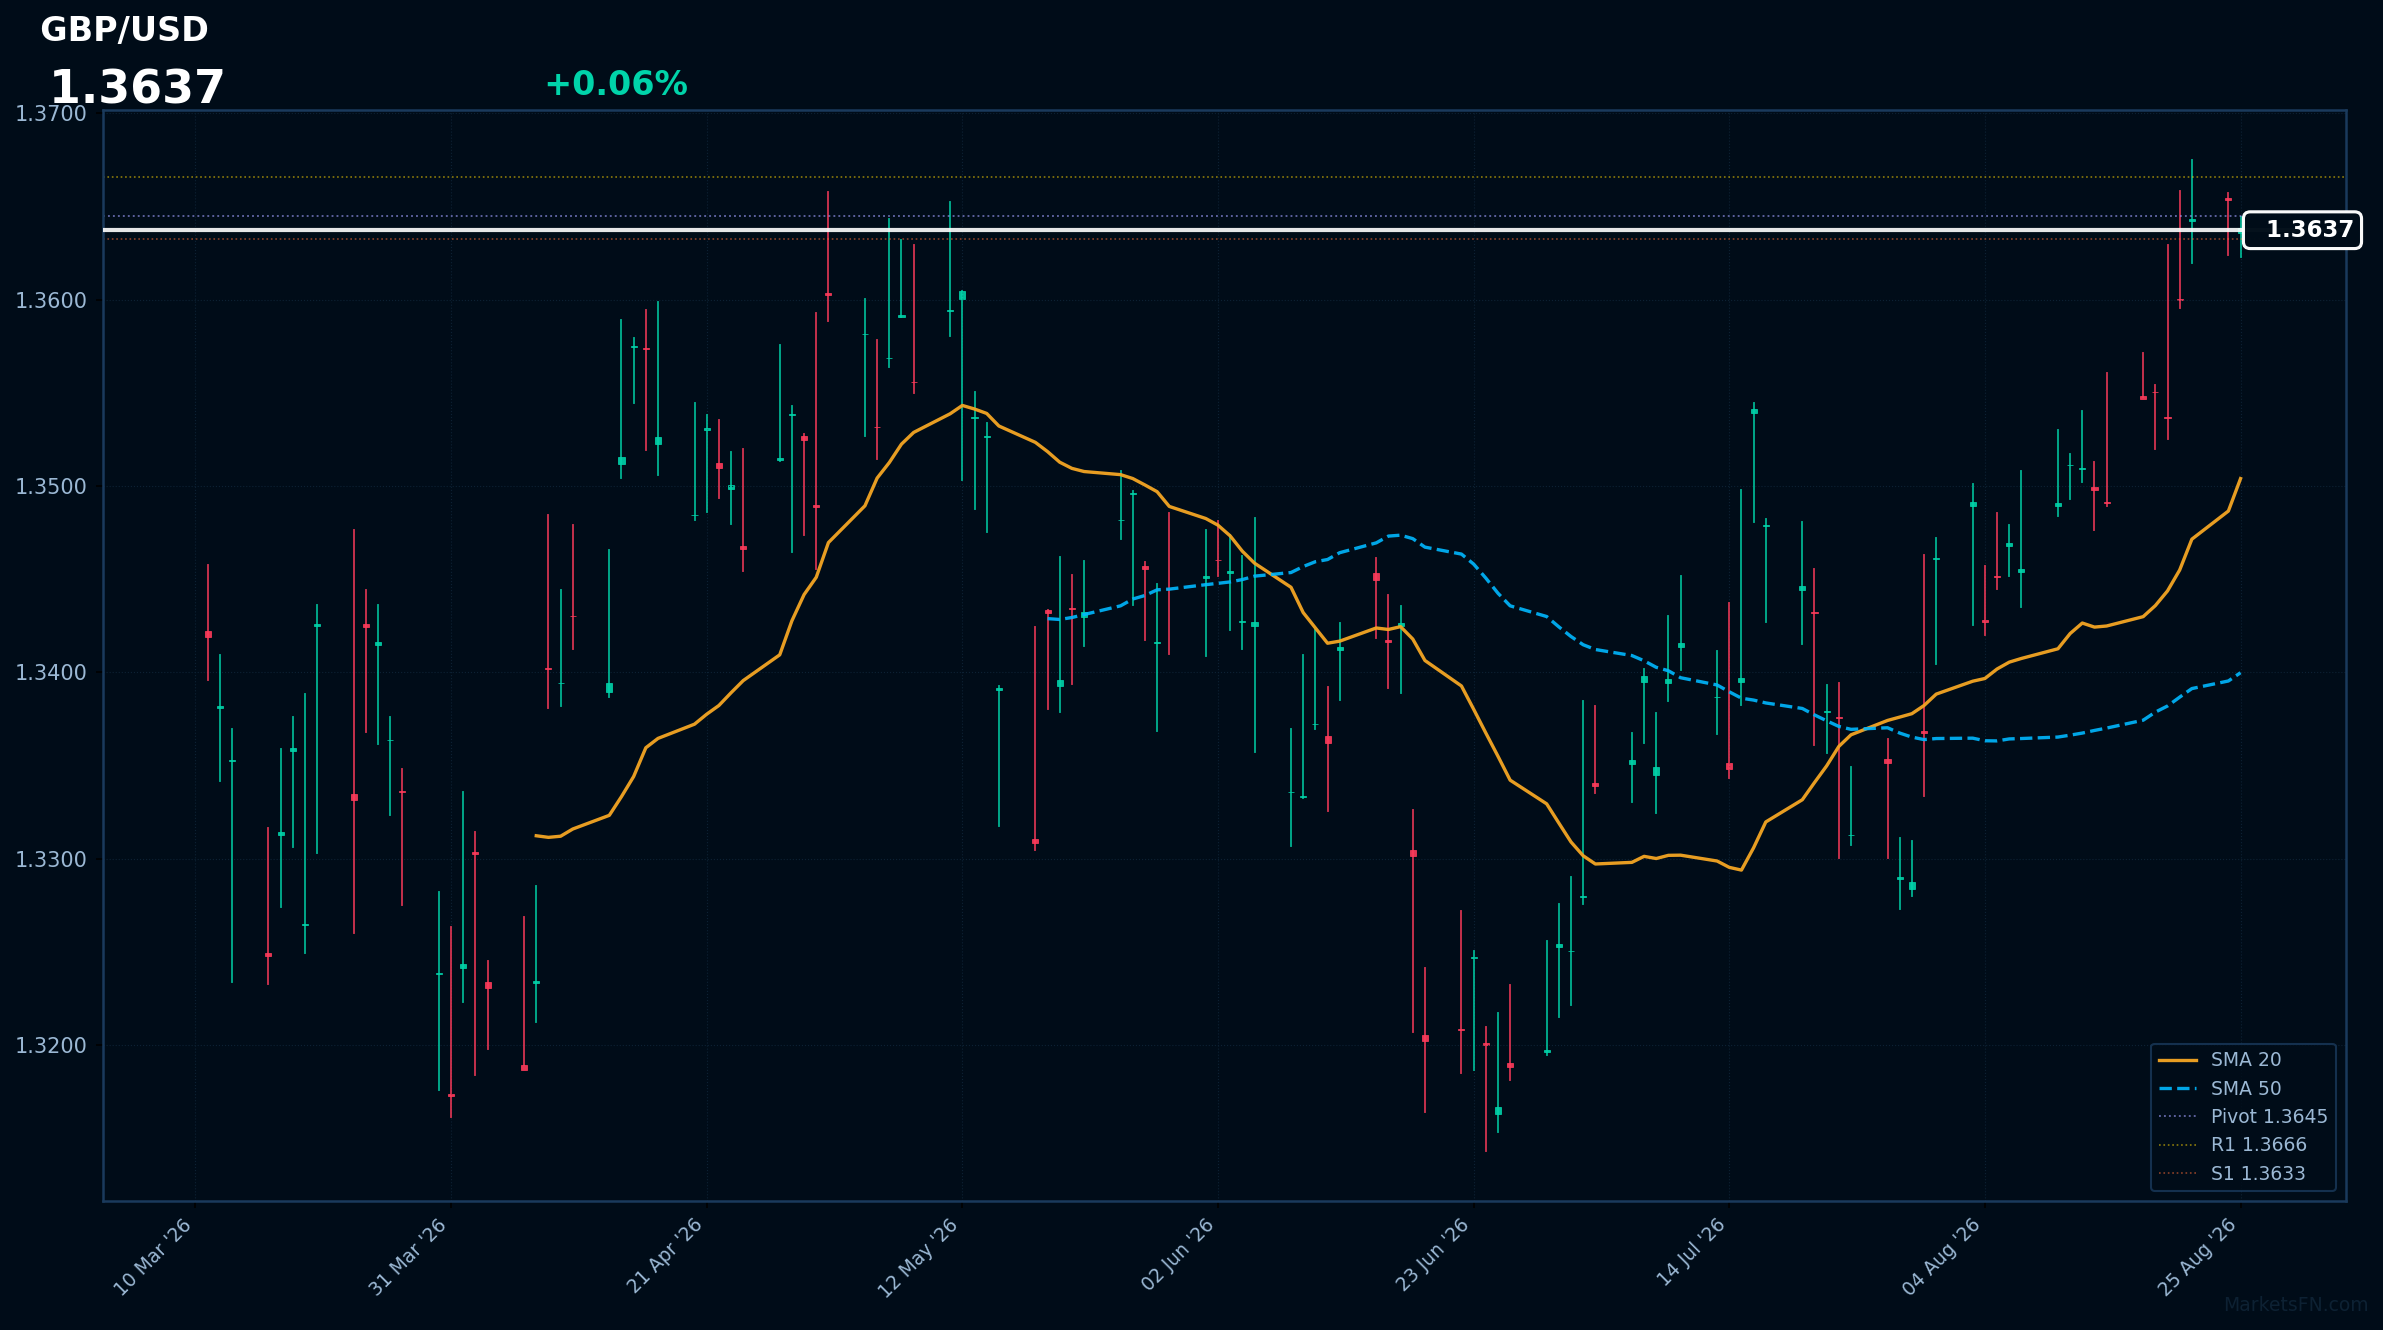
GBP/USD is trading at 1.3637 (+0.06%) as the currency pair continues to show resilience in the face of broader market dynamics. The current rate is positioned above both the 20-day simple moving average (SMA) of 1.3504 and the 50-day SMA of 1.3400, indicating a strong uptrend. This bullish sentiment is further supported by the recent price action, which has seen the pair oscillate within a day range of 1.3623 to 1.3645.
However, the Relative Strength Index (RSI) at 79.7 suggests that GBP/USD is in overbought territory, which could signal a potential pullback or consolidation in the near term. The Average True Range (ATR) of 0.0059 indicates relatively low daily volatility, suggesting that while the pair is trending upward, the pace of movement may be slowing.
Key technical levels to watch include the pivot point at 1.3645, which serves as immediate resistance, with the first resistance level (R1) at 1.3666. On the downside, the first support level (S1) is positioned at 1.3633, providing a buffer against potential declines.
Looking ahead, the market may be underpricing the potential for a correction given the overbought conditions. A decisive break above 1.3666 could signal further bullish momentum, while a drop below 1.3633 would indicate a shift in sentiment and warrant caution among traders.
Disclaimer
The content on MarketsFN.com is provided for educational and informational purposes only. It does not constitute financial advice or investment recommendations. All investments involve risks and past performance does not guarantee future results. You are solely responsible for your investment decisions.