GBP/USD: Down 0.16% to 1.3376 — Price Holds Above SMA-20
MarketsFN Team
GBP/USD: Down 0.16% to 1.3376 — Price Holds Above SMA-20
Published: October 23, 2026 · MarketsFN Team
| Pair | Rate | Change | RSI(14) | SMA-20 | SMA-50 | 52W High | 52W Low | Pivot | R1 | S1 |
|---|---|---|---|---|---|---|---|---|---|---|
| GBP/USD | 1.3376 | -0.16% | 63.5 | 1.3268 | 1.3409 | 1.3654 | 1.3167 | 1.3390 | 1.3423 | 1.3362 |
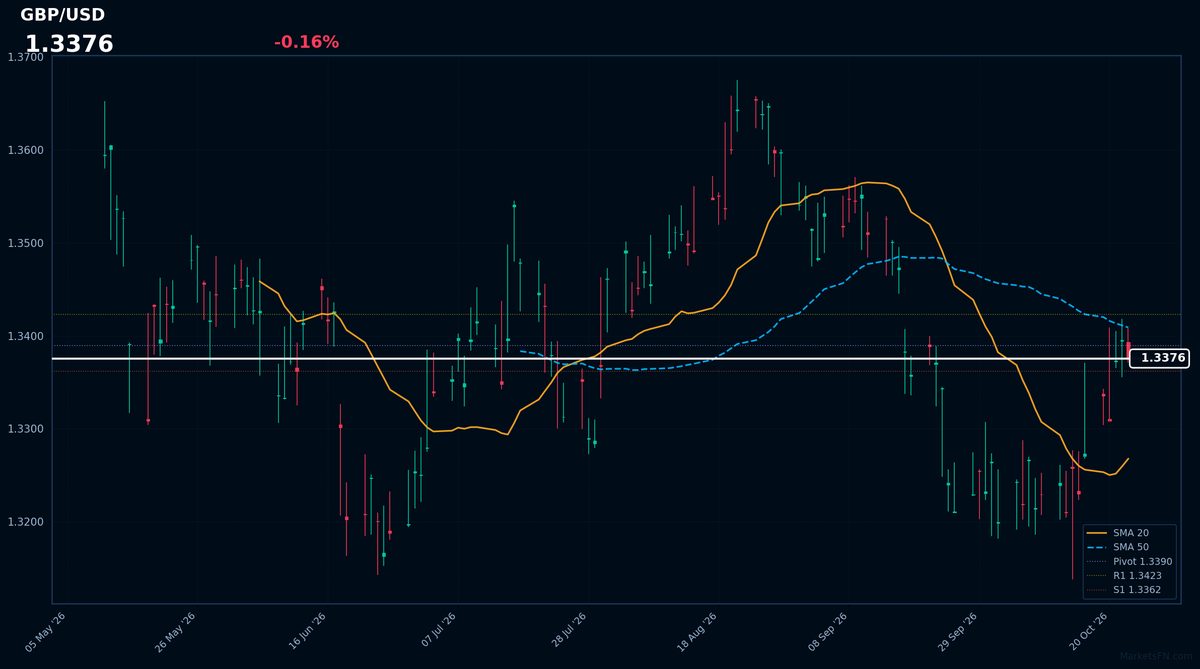
GBP/USD is trading at 1.3376, down 0.16% on the day, as it consolidates within a narrow range of 1.3371 to 1.3408. The current rate is sandwiched between its 20-day and 50-day simple moving averages, at 1.3268 and 1.3409 respectively, indicating a potential consolidation phase as the currency pair oscillates between these key trend indicators. The Relative Strength Index at 63.5 remains in neutral territory, suggesting that the pound is not overbought or oversold against the dollar. The Average True Range of 0.0077 indicates moderate daily volatility.
The pivot point at 1.3390 is closely watched, with the first resistance level, R1, at 1.3423 and the first support level, S1, at 1.3362. The current price is below the pivot and R1, but above S1, indicating a cautious stance from traders. The market may be underpricing the potential breakout from this consolidation phase, with a move above 1.3423 or below 1.3362 likely to signal the next directional bias.
A forward catalyst for GBP/USD will be the upcoming UK economic data releases, which could either validate a breakout above the 50-day SMA or confirm a drop below the 20-day SMA, thus providing clarity on the currency pair's next move.
Disclaimer
The content on MarketsFN.com is provided for educational and informational purposes only. It does not constitute financial advice or investment recommendations. All investments involve risks and past performance does not guarantee future results. You are solely responsible for your investment decisions.