AUD and NZD Lead G10 Losses as Risk Sentiment Falters; USD/TRY Hits a 52-Week High While USD/JPY Holds 61 Pips Above Its 2026 Floor
MarketsFN FX Desk

The European morning session on Thursday, September 10 opened with a clear divergence in G10 performance. The commodity-linked currencies — the Australian dollar and the New Zealand dollar — bore the brunt of the risk-off move, declining 0.80% and 0.95% respectively, each breaking through multiple pivot support levels in a single session. AUD/USD's daily low at 0.7161 signals a decisive reversal from the week's highs, marking a technical failure just below the 52-week peak at 0.7239.
In contrast, the safe-haven Japanese yen extended its year-to-date rally, pushing USD/JPY to within 61 pips of its 2026 floor at 152.90 — a level the pair has not breached since late January. At an Average True Range of 1.60 handles, the annual low is effectively within one session's reach. The Ministry of Finance and the Bank of Japan are both on high alert; any BOJ rate hike signal at this juncture would likely accelerate the yen's advance and push USD/JPY into fresh multi-year lows.
The Turkish lira hit its weakest level of the year, with USD/TRY touching the 52-week high at 48.503 during intraday trading. Despite the CBRT holding the benchmark rate at 50% — the highest among G20 central banks — structural TRY depreciation continues to be driven by inflation dynamics, a persistent current account deficit, and reduced external inflows. The daily range (48.364–48.503) is unusually compressed relative to the ATR of 72 pips, suggesting the pair is coiling ahead of a larger directional move.
The ECB holds centre stage today: the deposit rate decision is due at 13:45 CET, with President Lagarde's press conference at 14:30. Markets are pricing a 25bp cut with high conviction, which would bring the deposit rate to 3.25%. An unchanged decision would be a material surprise and trigger sharp EUR volatility across the board. More important than the decision itself will be Lagarde's forward guidance on the pace of subsequent cuts: a signal of pause would support EUR broadly; a commitment to sequential cuts could press EUR/USD back toward 1.1550 support.
In the Nordics, the Norwegian krone extended its outperformance for a fifth consecutive session. USD/NOK's session low at 9.172 matched the 52-week floor exactly, underscoring Norges Bank's hawkish-hold stance at 4.50% as the key divergence driver versus a Federal Reserve that is actively moving toward cuts. NOK/SEK also touched a 52-week high at 1.0435 before pulling back modestly, reflecting the widening policy gap between Oslo and Stockholm, where the Riksbank has already cut to 3.25%.
The dollar index (DXY) hovers near 102.14, consistent with a USD under broad structural pressure. Gold at $2,488 reflects ongoing safe-haven demand. US equity futures are softer (S&P −0.42%), adding modest tailwinds to JPY, CHF, and NOK while weighing on AUD and NZD. The week closes with a clear message from the FX market: the commodity-linked bloc is vulnerable until China-related demand signals improve, and the yen floor at 152.90 is the single most important technical level to watch into Friday's close.
Today's Economic Calendar
| Time | Event | CCY | Forecast | Previous |
|---|---|---|---|---|
| 13:30 CET | ● Initial Jobless Claims (Sep 6) | USD | 230K | 228K |
| 13:30 CET | ● PPI ex Food & Energy (MoM Aug) | USD | 0.2% | 0.2% |
| 13:45 CET | ● ECB Deposit Rate Decision | EUR | 3.25% | 3.50% |
| 14:30 CET | ● ECB Press Conference (Lagarde) | EUR | — | — |
| 15:30 CET | ● DOE Natural Gas Storage | USD | +28B | +13B |
Majors
EUR/USD
1.1613 ▼0.12% H 1.1644 L 1.1597 52W 1.1325–1.1712
| R2 | R1 | Pivot | S1 | S2 |
|---|---|---|---|---|
| 1.1666 | 1.1647 | 1.1618 | 1.1615 | 1.1602 |
EUR/USD consolidates 0.86% below the 52-week high of 1.1712, printing a mild inside day as both USD bears and EUR bulls absorb this week's data flow. The pair sits directly on S1 at 1.1615 — a close beneath opens 1.1602 (S2). The 52-week range (1.1325–1.1712) places current price in the upper quartile, reflecting sustained USD structural weakness from Fed cut expectations. R1 at 1.1647 matches yesterday's daily high and is the level to reclaim for bulls. A clean break above R2 at 1.1666 marks the path to the yearly high at 1.1712.
BearishNear 52W HighS1 TestFed Cut Priced
GBP/USD
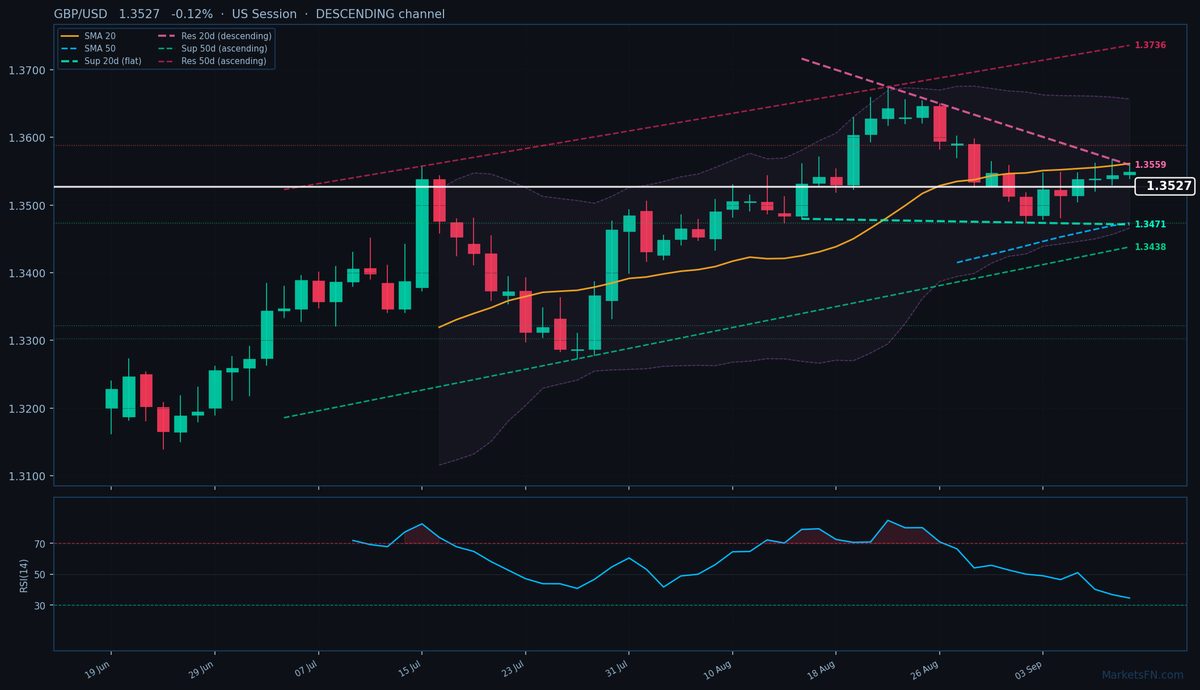
1.3509 ▼0.26% H 1.3560 L 1.3493 52W 1.3143–1.3675
| R2 | R1 | Pivot | S1 | S2 |
|---|---|---|---|---|
| 1.3587 | 1.3566 | 1.3521 | 1.3528 | 1.3511 |
Sterling eases 0.26%, the session low at 1.3493 breaching S1 (1.3528) intraday. The 52-week high at 1.3675 remains 1.66% above — plenty of room for continuation if the BOE holds and US data disappoints. A close below S1 targets 1.3511 (S2). Above R1 at 1.3566, the path reopens to 1.3587 (R2). Today's pullback looks corrective rather than structural: GBP's fundamental backdrop (BOE on hold, UK services CPI above 5.5%) remains intact. The NY close at or above S1 will be the session verdict.
PullbackBOE HoldNear 52W HighS1 Broken
USD/JPY
153.51 ▲+0.02% H 154.67 L 153.27 52W 152.90–163.98
| R2 | R1 | Pivot | S1 | S2 |
|---|---|---|---|---|
| 154.25 | 153.87 | 153.82 | 153.04 | 152.60 |
USD/JPY trades just 61 pips above its 52-week low of 152.90 — technically fragile. At an ATR of 1.60 handles, the annual floor is within one session's range. S1 at 153.04 is the immediate buffer; below that S2 at 152.60, then S3 at 152.21, before the 150 psychological level. Today's intraday high of 154.67 (near R2) was quickly rejected, confirming bearish structure. BOJ policy normalisation remains the fundamental anchor — any rate hike signal accelerates yen gains. Watch MOF commentary closely this week.
Near 52W LowBOJ TighteningYen StrengthCritical Floor
USD/CHF
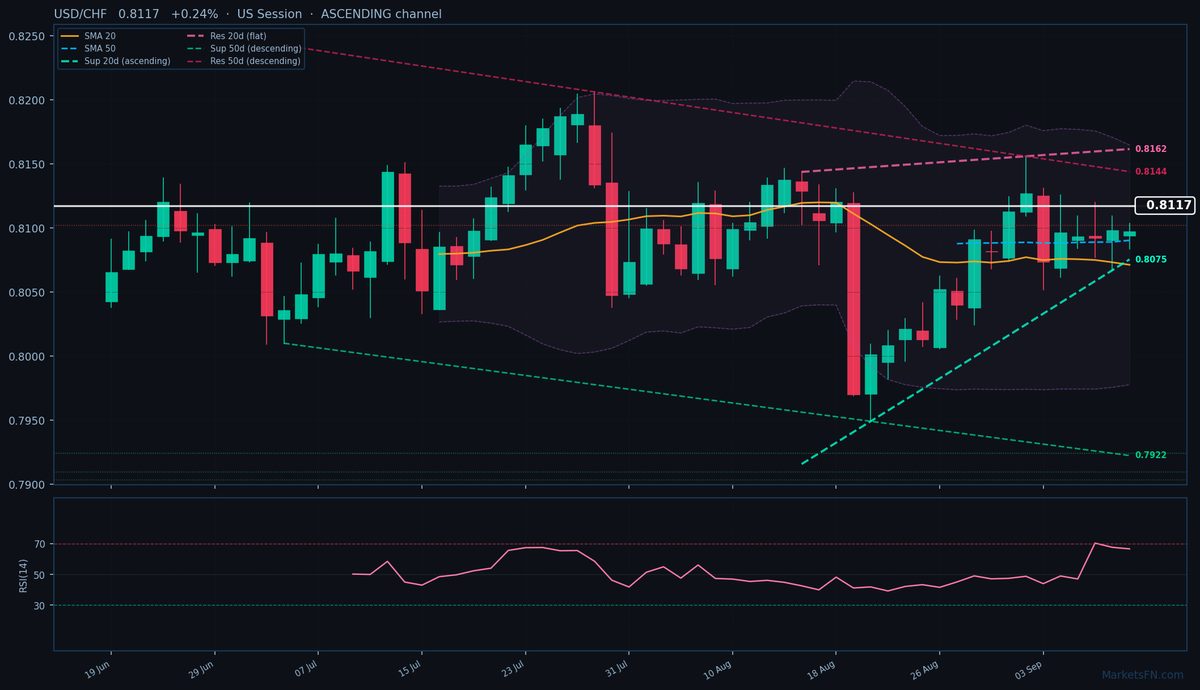
0.8093 ▲+0.02% H 0.8147 L 0.8084 52W 0.7909–0.8205
| R2 | R1 | Pivot | S1 | S2 |
|---|---|---|---|---|
| 0.8131 | 0.8111 | 0.8108 | 0.8068 | 0.8046 |
USD/CHF consolidates in the lower half of its 52-week range (0.7909–0.8205), edging fractionally higher. The SNB has cut rates aggressively, limiting CHF upside from fundamentals — but risk-off demand can override policy short-term. R1 at 0.8111 aligns with this week's intraday highs and is the key level to reclaim for a meaningful recovery. S1 at 0.8068 provides support below. Current price (0.8093) sits in the lower half of the annual range, confirming the structural bias remains USD/CHF lower over the medium term.
Mild BounceSNB CutsRange MidR1 Watch
AUD/USD
0.7162 ▼0.80% H 0.7225 L 0.7161 52W 0.6866–0.7239
| R2 | R1 | Pivot | S1 | S2 |
|---|---|---|---|---|
| 0.7252 | 0.7236 | 0.7183 | 0.7207 | 0.7194 |
AUD/USD is today's worst G10 performer at −0.80%, breaking below S1 (0.7207) and S2 (0.7194) in a single session. The sharp retreat follows a failed push toward the 52-week high of 0.7239. Today's low at 0.7161 is a bearish reversal candle from near-highs — a pattern that historically precedes 1–2% corrective moves. China sentiment and broader risk-off are the primary catalysts. S3 at 0.7178 is the key downside target; recovery above 0.7207 (S1) is needed to neutralise the bearish signal.
BearishNear 52W HighMulti-S BreakChina Risk
NZD/USD
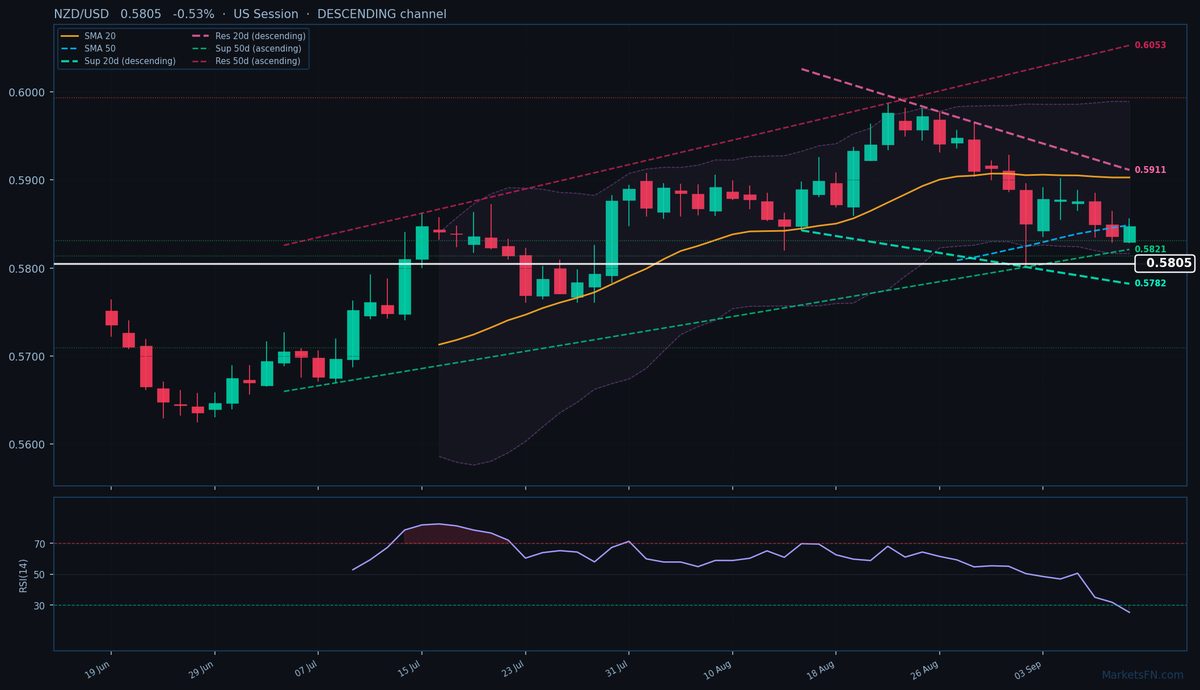
0.5803 ▼0.95% H 0.5858 L 0.5800 52W 0.5628–0.5989
| R2 | R1 | Pivot | S1 | S2 |
|---|---|---|---|---|
| 0.5886 | 0.5873 | 0.5820 | 0.5838 | 0.5818 |
NZD/USD leads all G10 pairs lower at −0.95%, collapsing through S1, S2, and touching S3 at 0.5804 at the session low. RBNZ cut expectations, softer China demand signals, and global risk-off are all compressing the kiwi simultaneously. The 52-week range (0.5628–0.5989) places current price just above the midpoint, with room for further downside. A recovery above S2 at 0.5818 is the minimum needed to stabilise. Avoid catching this knife before a daily close recovery.
BearishRBNZ CutsMulti-S BreachSession Low S3
USD/CAD
1.3798 ▲+0.14% H 1.3835 L 1.3793 52W 1.3733–1.4248
| R2 | R1 | Pivot | S1 | S2 |
|---|---|---|---|---|
| 1.3842 | 1.3810 | 1.3809 | 1.3756 | 1.3734 |
USD/CAD finds mild support, trading 65 pips above its 52-week low of 1.3733. R1 at 1.3810 aligns with today's intraday high of 1.3835; R2 at 1.3842 is the next resistance cluster. Oil (WTI) direction is critical — CAD is commodity-linked, and energy recovery reinforces USD/CAD downside. Both BOC and the Fed are in easing mode, keeping the pair fundamentally range-bound. S1 at 1.3756 is the key support below.
Mild RecoveryNear 52W LowOil LinkedBOC Dovish
Crosses
EUR/GBP
0.8587 ▲+0.02% H 0.8597 L 0.8583 52W 0.8468–0.8680
| R2 | R1 | Pivot | S1 | S2 |
|---|---|---|---|---|
| 0.8601 | 0.8593 | 0.8589 | 0.8579 | 0.8573 |
EUR/GBP is pinned in a 14-pip intraday range (0.8583–0.8597) — one of the tightest consolidations in months. Current price (0.8587) is sandwiched between S1 (0.8579) and R1 (0.8593). This degree of compression is unsustainable; the next central bank catalyst will trigger a directional break. ECB/BOE divergence is the dominant fundamental: BOE holds while ECB cuts, a bearish structural bias for the cross.
Tight RangeECB vs BOECompressionBreakout Risk
EUR/JPY
178.60 ▲+0.08% H 179.48 L 178.41 52W 177.86–187.41
| R2 | R1 | Pivot | S1 | S2 |
|---|---|---|---|---|
| 179.21 | 178.83 | 178.83 | 178.10 | 177.74 |
EUR/JPY is 74 pips above its 52-week low of 177.86, caught between JPY structural strength and EUR weakness. BOJ normalisation (JPY bullish) and ECB cuts (EUR bearish) form a structural double-headwind. R1 at 178.83 capped the session high at 179.48 before sellers returned. S1 at 178.10 and the 52-week floor at 177.86 are the key downside targets. A break below 177.86 would mark a new 52-week low.
Near 52W LowBOJ BullishECB DragFloor Watch
GBP/JPY
207.88 ▲+0.01% H 208.88 L 207.75 52W 207.10–219.52
| R2 | R1 | Pivot | S1 | S2 |
|---|---|---|---|---|
| 208.74 | 208.29 | 208.17 | 207.43 | 207.01 |
GBP/JPY hovers 78 pips above its 52-week low of 207.10, held up by BOE hawkish-hold providing a structural GBP floor. At an ATR of 1.92 handles, the annual low is less than half a session's range away. S1 at 207.43 is the immediate buffer; below 207.10, the cross enters its lowest level in over a year. Wide position sizing is warranted given the elevated ATR.
Near 52W LowBOE FloorHigh VolatilityAnnual Low Risk
AUD/JPY
110.65 ▼0.15% H 111.01 L 110.35 52W 109.24–114.96
| R2 | R1 | Pivot | S1 | S2 |
|---|---|---|---|---|
| 111.31 | 111.06 | 110.67 | 110.61 | 110.40 |
AUD/JPY reflects the dual pressure of today's AUD weakness (−0.80%) compounded by structurally strong JPY. The pair tested S1 at 110.61 during the session low of 110.35. The 52-week range (109.24–114.96) places current price in the lower half — structural bias is lower. S2 at 110.40 is the next target if selling extends; above R1 at 111.06, 111.31 (R2) offers short-term relief.
Risk BarometerAUD DragS1 TestChina Linked
Nordics
USD/NOK
9.186 ▼0.33% H 9.283 L 9.172 52W 9.172–9.962
| R2 | R1 | Pivot | S1 | S2 |
|---|---|---|---|---|
| 9.246 | 9.231 | 9.214 | 9.188 | 9.161 |
USD/NOK today's low of 9.172 matches the 52-week low exactly — the pair is testing its annual floor in real time. Norges Bank holds at 4.50% (the most hawkish major central bank), creating structural NOK demand. S1 at 9.188 is the immediate support; below the 52-week low at 9.172 there is no chart-based support — only psychological levels. A close above R1 at 9.231 would signal a temporary bottom; until then the trend is unambiguously NOK stronger.
At 52W LowNorges HoldNOK StrongFloor Probe
USD/SEK
9.577 ▼0.06% H 9.683 L 9.567 52W 9.336–9.793
| R2 | R1 | Pivot | S1 | S2 |
|---|---|---|---|---|
| 9.632 | 9.608 | 9.609 | 9.561 | 9.538 |
USD/SEK eases modestly, consolidating mid-range. The Riksbank cutting cycle (from 4.00% to 3.25%) has made SEK structurally weaker than NOK. R1 at 9.608 was tested via the session high of 9.683 before sellers returned. S1 at 9.561 matches the session low. The 52-week range (9.336–9.793) places current price at 9.577 in the upper half, consistent with SEK structural weakness.
Mild DropRiksbank CutsRange MidR1 Capped
EUR/NOK
10.699 ▼0.16% H 10.776 L 10.695 52W 10.688–11.356
| R2 | R1 | Pivot | S1 | S2 |
|---|---|---|---|---|
| 10.747 | 10.732 | 10.723 | 10.695 | 10.673 |
EUR/NOK at 10.699 is just 11 pips above its 52-week low of 10.688 — the lowest level in over a year. ECB cuts (EUR bearish) combined with Norges Bank hold (NOK bullish) create a structural double-force lower. Today's low at 10.695 essentially tested the floor. S1 at 10.695 is the current pivot; below 10.688 the cross breaks into new yearly-low territory.
At 52W LowECB CutsNOK BidFloor Test
NOK/SEK
1.0358 ▼0.33% H 1.0435 L 1.0358 52W 0.9660–1.0435
| R2 | R1 | Pivot | S1 | S2 |
|---|---|---|---|---|
| 1.0460 | 1.0426 | 1.0384 | 1.0365 | 1.0338 |
NOK/SEK hit its 52-week high of 1.0435 today before pulling back to 1.0358 at the session close. This session high equals the annual peak. The pullback is not a reversal; the Norges/Riksbank policy divergence (hold vs cut) is structural and intact. S1 at 1.0365 and S2 at 1.0338 are the buy-dip levels within the ongoing NOK/SEK uptrend.
52W High TodayNorges vs RiksbankPullbackBuy Dips
Exotics
USD/TRY
48.468 ▲+0.01% H 48.503 L 48.364 52W 46.209–48.503
| R2 | R1 | Pivot | S1 | S2 |
|---|---|---|---|---|
| 48.485 | 48.474 | 48.445 | 48.456 | 48.449 |
USD/TRY today's high of 48.503 equals the 52-week high — the lira is at its weakest in a year. CBRT holds at 50% (G20's highest policy rate) but structural TRY depreciation is embedded in inflation and current account dynamics. The daily range (48.364–48.503) is extremely compressed at 139 pips vs ATR 72 — the pair is coiling. S1 at 48.456 is the key intraday support.
52W High TodayTRY Yearly LowCBRT 50%Carry Stress
USD/MXN
16.883 ▼0.16% H 17.012 L 16.878 52W 16.849–17.673
| R2 | R1 | Pivot | S1 | S2 |
|---|---|---|---|---|
| 16.943 | 16.926 | 16.924 | 16.882 | 16.855 |
USD/MXN eases toward the 52-week low of 16.849, with today's session low at 16.878 just 29 pips above the annual floor. Banxico holds at 11.00%, maintaining one of the largest real rate differentials in LatAm. S1 at 16.882 is the immediate support; a close below 16.849 would mark a new yearly low. R1 at 16.926 capped the recovery attempt after the morning session high at 17.012.
MXN RecoveryBanxico HoldNear 52W LowOil Support
USD/ZAR
17.58 ▼0.29% H 17.72 L 17.52 52W 17.52–18.99
| R2 | R1 | Pivot | S1 | S2 |
|---|---|---|---|---|
| 17.69 | 17.64 | 17.61 | 17.53 | 17.48 |
USD/ZAR today's session low of 17.52 matches the 52-week low — the rand is at peak strength for the year. Gold near $2,488 provides ZAR support from the commodity side. S1 at 17.53 is the immediate pivot; below 17.52, the pair enters uncharted territory for the year. R1 at 17.64 is the key recovery level; the spread between current price (17.58) and the 52-week high (18.99) illustrates the magnitude of ZAR appreciation in 2026.
At 52W LowZAR RallyRisk-Off BufferCommodity FX
USD/PLN
3.7850 ▼0.18% H 3.8120 L 3.7810 52W 3.7810–4.1280
| R2 | R1 | Pivot | S1 | S2 |
|---|---|---|---|---|
| 3.8096 | 3.7994 | 3.7927 | 3.7787 | 3.7685 |
USD/PLN today's session low of 3.7810 equals the 52-week low — the złoty is at its strongest level of the year. EU convergence themes and NBP caution on rate cuts are supporting the currency. S1 at 3.7787 is the first pivot below the 52-week floor; above R1 at 3.7994, the pair attempts to stabilise. The full 52-week range (3.7810–4.1280) illustrates the substantial PLN appreciation in 2026, driven by EU fiscal flows and relative rate stability.
At 52W LowNBP CautiousPLN BidEU Convergence
This analysis is provided for informational purposes only and does not constitute investment advice. FX markets involve substantial risk. Pivot levels are computed from the prior session's High, Low and Close. Data sourced from market feeds as of the EU session open, Thu 10 Sep 2026.