FX Midday Briefing — Fri 16 Oct 2026: NZD/USD Gains 0.79% as US Session Kicks Off
MarketsFN FX Desk

Mid-session update on Friday 16 October 2026: with the US session underway, G10 and emerging FX markets are showing 11 pairs bid and 7 offered against the Dollar. The session's leading movers are NZD/USD (+0.79%), USD/MXN (+0.78%), USD/SEK (+0.76%). Cross-asset flows from US equity and bond markets are increasingly influencing FX positioning as European traders hand off to their New York counterparts.
This midday snapshot includes updated intraday pivot levels, the full day's economic calendar with actual releases for morning data, and fresh candlestick charts for all 19 pairs. Afternoon risk events — if any remain on the calendar — are flagged in the calendar section below.
All pivot levels (R1 R2 R3 / S1 S2 S3) are computed from yesterday's full-session OHLC via the standard floor-pivot formula. Charts cover 65 daily bars with SMA20, SMA50 and Bollinger Bands (20,2).
Today's Economic Calendar
| Time (UTC) | Event | CCY | Previous | Forecast | Actual |
|---|---|---|---|---|---|
| 02:00 | ● BoE Gov Bailey Speaks | GBP | — | — | — |
| 02:30 | ● German Buba President Nagel Speaks | EUR | — | — | — |
| 03:30 | ● Fed Chair Warsh Speaks | USD | — | — | — |
| 04:00 | ● GDP (YoY) (Q3) | MYR | 6.0% | — | 5.3% |
| 04:15 | ● BoC Gov Macklem Speaks | CAD | — | — | — |
| 09:00 | ● Core CPI (YoY) (Sep) | EUR | 2.4% | 2.5% | 2.5% |
| 09:00 | ● CPI (YoY) (Sep) | EUR | 3.2% | 3.8% | 3.8% |
| 09:00 | ● CPI (MoM) (Sep) | EUR | 0.4% | 0.6% | 0.6% |
| 09:00 | ● Trade Balance (Aug) | EUR | 10.7B | — | -16.1B |
| 12:15 | ● Housing Starts (Sep) | CAD | 242.2K | 234.0K | 248.9K |
| 12:30 | ● Export Price Index (MoM) (Sep) | USD | 1.2% | 1.0% | 2.2% |
| 12:30 | ● Import Price Index (MoM) (Sep) | USD | 0.5% | 0.9% | 1.1% |
| 12:30 | ● Foreign Securities Purchases (Aug) | CAD | 20.64B | 23.59B | -17.31B |
| 13:15 | ● Industrial Production (MoM) (Sep) | USD | 0.1% | 0.4% | 0.7% |
| 13:15 | ● Industrial Production (YoY) (Sep) | USD | 1.42% | — | 2.20% |
| 17:00 | ● U.S. Baker Hughes Oil Rig Count | USD | 462 | — | — |
| 17:00 | ● U.S. Baker Hughes Total Rig Count | USD | 603 | — | — |
| 18:00 | ● Federal Budget Balance (Sep) | USD | -167.0B | -34.7B | — |
| 19:30 | ● CFTC GBP speculative net positions | GBP | -97.6K | — | — |
| 19:30 | ● CFTC Crude Oil speculative net positions | USD | 99.1K | — | — |
| 19:30 | ● CFTC Gold speculative net positions | USD | 210.3K | — | — |
| 19:30 | ● CFTC Nasdaq 100 speculative net positions | USD | 58.1K | — | — |
| 19:30 | ● CFTC S&P 500 speculative net positions | USD | -154.1K | — | — |
| 19:30 | ● CFTC AUD speculative net positions | AUD | -98.6K | — | — |
| 19:30 | ● CFTC BRL speculative net positions | BRL | 52.3K | — | — |
| 19:30 | ● CFTC JPY speculative net positions | JPY | 62.3K | — | — |
| 19:30 | ● CFTC EUR speculative net positions | EUR | -99.3K | — | — |
| 20:00 | ● TIC Net Long-Term Transactions (Aug) | USD | -27.9B | 75.2B | — |
Major Pairs
EUR/USD
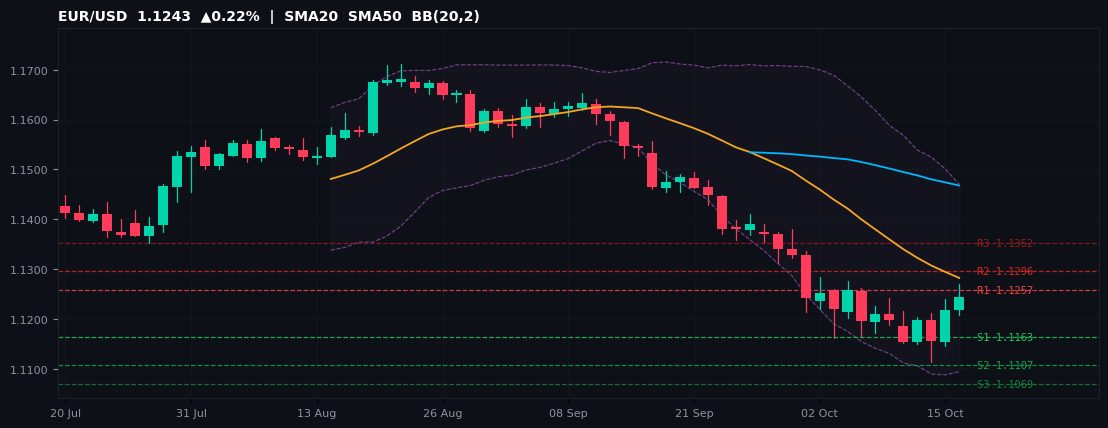
1.1243 ▲0.22% Day H 1.1269 / L 1.1208 52W 1.1112–1.2082
| R3 | R2 | R1 | S1 | S2 | S3 |
|---|---|---|---|---|---|
| 1.1352 | 1.1296 | 1.1257 | 1.1163 | 1.1107 | 1.1069 |
With the US session now active, EUR/USD trades at 1.1243 (+0.22% vs. yesterday's close), just 1.17% above its 52-week floor at 1.1112. Today's intraday range of 1.1208–1.1269 (0.0062 pips) is above the average daily range. The intraday bias tilts bullish with price above the daily pivot at 1.1202.
Price is closest to R1 at 1.1257 — a decisive break above R1 (1.1257) opens R2 (1.1296). The R1–S1 corridor (1.1257–1.1163) defines the equilibrium zone for the afternoon session; a sustained directional break will likely set the tone into tomorrow's Asian open.
For EUR/USD, the annual support remains the decisive level — bulls need a firm hold here to prevent a deeper pullback. The 52-week range of 1.1112–1.2082 places the pair at the 13th percentile annually. Key risk: any USD-moving headline into the NY close could extend the intraday range well beyond current pivot boundaries.
EUR/USDRangeboundNear 52W Low
GBP/USD
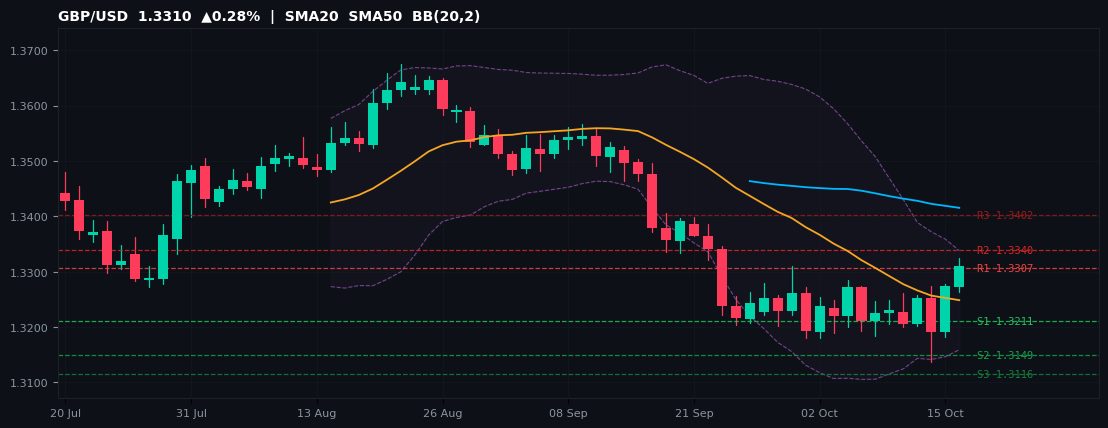
1.3310 ▲0.28% Day H 1.3324 / L 1.3264 52W 1.3009–1.3868
| R3 | R2 | R1 | S1 | S2 | S3 |
|---|---|---|---|---|---|
| 1.3402 | 1.3340 | 1.3307 | 1.3211 | 1.3149 | 1.3116 |
With the US session now active, GBP/USD trades at 1.3310 (+0.28% vs. yesterday's close), at the 35th percentile of its 1.3009–1.3868 52-week range. Today's intraday range of 1.3264–1.3324 (0.0060 pips) is above the average daily range. The intraday bias tilts bullish with price above the daily pivot at 1.3244.
Price is closest to R1 at 1.3307 — a decisive break above R1 (1.3307) opens R2 (1.3340). The R1–S1 corridor (1.3307–1.3211) defines the equilibrium zone for the afternoon session; a sustained directional break will likely set the tone into tomorrow's Asian open.
For GBP/USD, price is in the lower half of its annual range, keeping the path of least resistance lower. The 52-week range of 1.3009–1.3868 places the pair at the 35th percentile annually. Key risk: any USD-moving headline into the NY close could extend the intraday range well beyond current pivot boundaries.
GBP/USDRangeboundAbove R1
USD/JPY
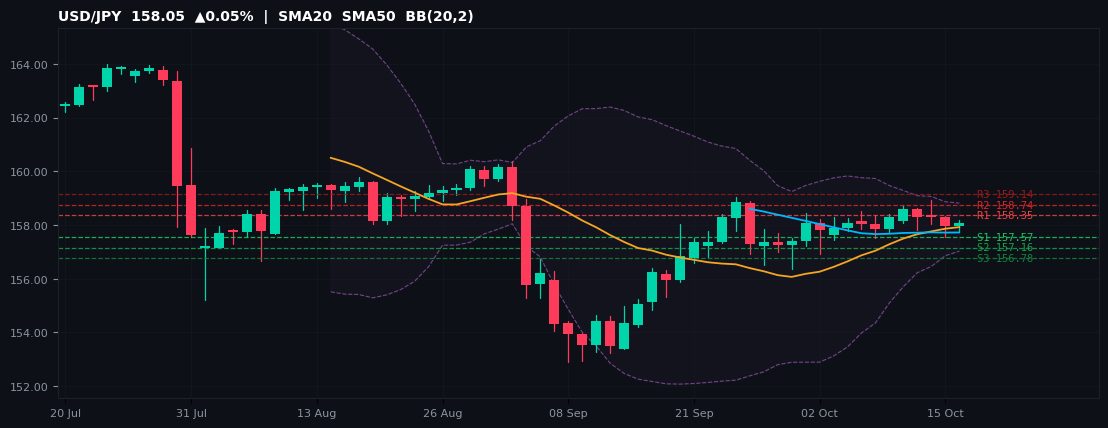
158.05 ▲0.05% Day H 158.18 / L 157.79 52W 151.53–163.98
| R3 | R2 | R1 | S1 | S2 | S3 |
|---|---|---|---|---|---|
| 159.14 | 158.74 | 158.35 | 157.57 | 157.16 | 156.78 |
With the US session now active, USD/JPY trades at 158.05 (+0.05% vs. yesterday's close), at the 52th percentile of its 151.53–163.98 52-week range. Today's intraday range of 157.79–158.18 (0.39 pips) is above the average daily range. The intraday bias tilts bullish with price above the daily pivot at 157.95.
Price is closest to R1 at 158.35 — a decisive break above R1 (158.35) opens R2 (158.74). The R1–S1 corridor (158.35–157.57) defines the equilibrium zone for the afternoon session; a sustained directional break will likely set the tone into tomorrow's Asian open.
For USD/JPY, intraday momentum is constructive; the upper half of the annual range favours dip-buyers. The 52-week range of 151.53–163.98 places the pair at the 52th percentile annually. Key risk: any USD-moving headline into the NY close could extend the intraday range well beyond current pivot boundaries.
USD/JPYRangebound
USD/CHF
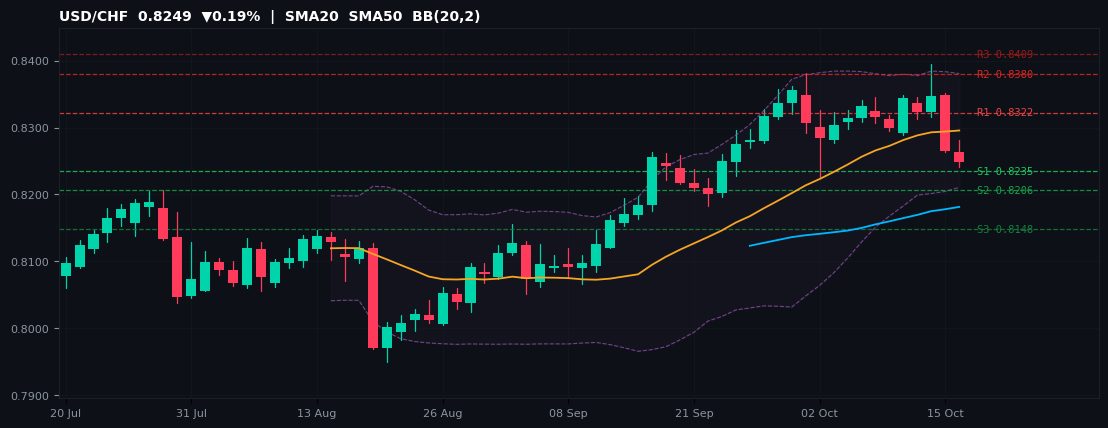
0.8249 ▼0.19% Day H 0.8282 / L 0.8240 52W 0.7602–0.8395
| R3 | R2 | R1 | S1 | S2 | S3 |
|---|---|---|---|---|---|
| 0.8409 | 0.8380 | 0.8322 | 0.8235 | 0.8206 | 0.8148 |
With the US session now active, USD/CHF trades at 0.8249 (-0.19% vs. yesterday's close), at the 82th percentile of its 0.7602–0.8395 52-week range. Today's intraday range of 0.8240–0.8282 (0.0041 pips) is above the average daily range. The intraday bias is neutral-to-bearish while price holds below the daily pivot at 0.8293.
Price is closest to S1 at 0.8235 — a decisive break below S1 (0.8235) exposes S2 (0.8206). The R1–S1 corridor (0.8322–0.8235) defines the equilibrium zone for the afternoon session; a sustained directional break will likely set the tone into tomorrow's Asian open.
For USD/CHF, intraday momentum is constructive; the upper half of the annual range favours dip-buyers. The 52-week range of 0.7602–0.8395 places the pair at the 82th percentile annually. Key risk: any USD-moving headline into the NY close could extend the intraday range well beyond current pivot boundaries.
USD/CHFRangebound
AUD/USD
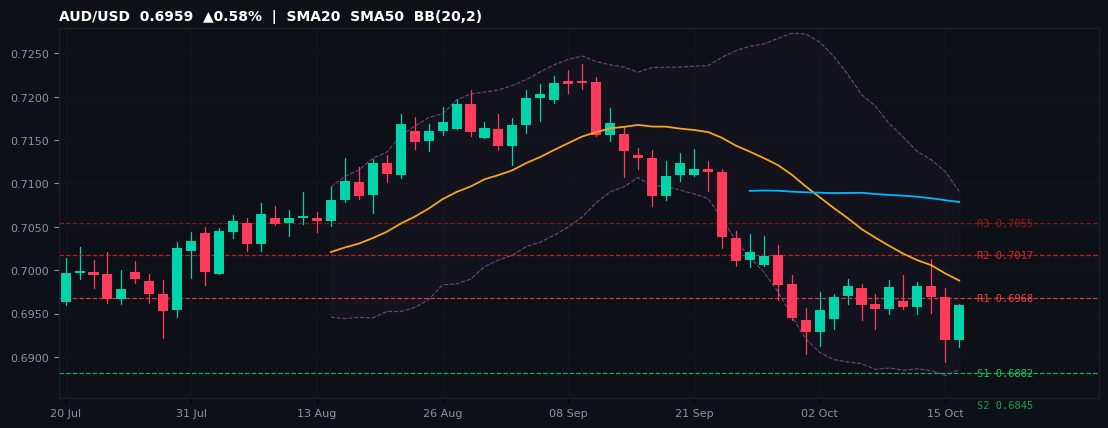
0.6959 ▲0.58% Day H 0.6962 / L 0.6911 52W 0.6421–0.7277
| R3 | R2 | R1 | S1 | S2 | S3 |
|---|---|---|---|---|---|
| 0.7055 | 0.7017 | 0.6968 | 0.6882 | 0.6845 | 0.6795 |
With the US session now active, AUD/USD trades at 0.6959 (+0.58% vs. yesterday's close), at the 63th percentile of its 0.6421–0.7277 52-week range. Today's intraday range of 0.6911–0.6962 (0.0050 pips) is above the average daily range. The intraday bias tilts bullish with price above the daily pivot at 0.6931.
Price is closest to R1 at 0.6968 — a decisive break above R1 (0.6968) opens R2 (0.7017). The R1–S1 corridor (0.6968–0.6882) defines the equilibrium zone for the afternoon session; a sustained directional break will likely set the tone into tomorrow's Asian open.
For AUD/USD, intraday momentum is constructive; the upper half of the annual range favours dip-buyers. The 52-week range of 0.6421–0.7277 places the pair at the 63th percentile annually. Key risk: any USD-moving headline into the NY close could extend the intraday range well beyond current pivot boundaries.
AUD/USDBullish
NZD/USD
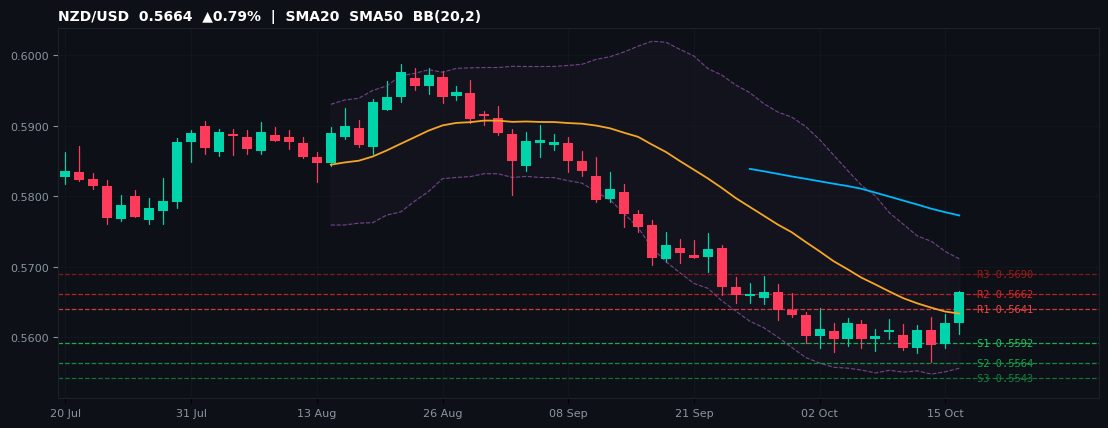
0.5664 ▲0.79% Day H 0.5666 / L 0.5605 52W 0.5564–0.6092
| R3 | R2 | R1 | S1 | S2 | S3 |
|---|---|---|---|---|---|
| 0.5690 | 0.5662 | 0.5641 | 0.5592 | 0.5564 | 0.5543 |
With the US session now active, NZD/USD trades at 0.5664 (+0.79% vs. yesterday's close), at the 19th percentile of its 0.5564–0.6092 52-week range. Today's intraday range of 0.5605–0.5666 (0.0060 pips) is above the average daily range. The intraday bias tilts bullish with price above the daily pivot at 0.5613.
Price is closest to R1 at 0.5641 — a decisive break above R1 (0.5641) opens R2 (0.5662). The R1–S1 corridor (0.5641–0.5592) defines the equilibrium zone for the afternoon session; a sustained directional break will likely set the tone into tomorrow's Asian open.
For NZD/USD, price is in the lower half of its annual range, keeping the path of least resistance lower. The 52-week range of 0.5564–0.6092 places the pair at the 19th percentile annually. Key risk: any USD-moving headline into the NY close could extend the intraday range well beyond current pivot boundaries.
NZD/USDBullishAbove R1
USD/CAD
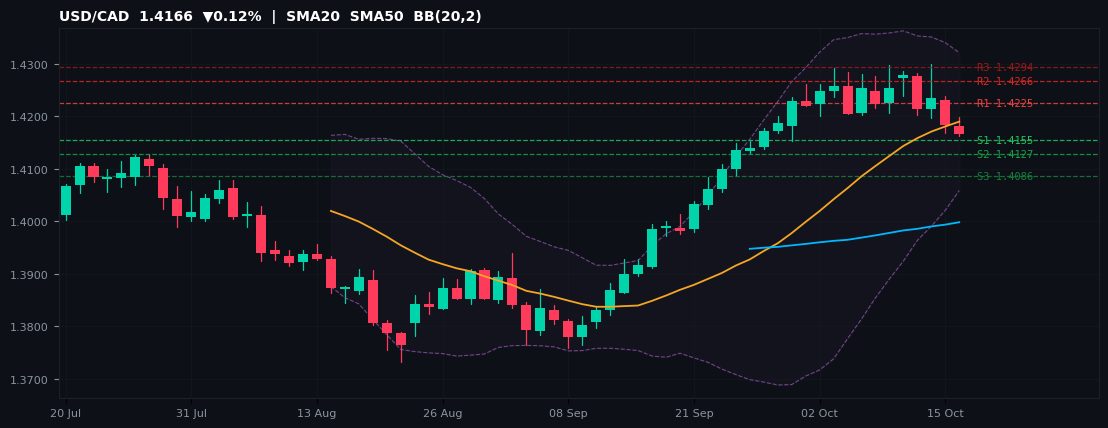
1.4166 ▼0.12% Day H 1.4198 / L 1.4162 52W 1.3480–1.4299
| R3 | R2 | R1 | S1 | S2 | S3 |
|---|---|---|---|---|---|
| 1.4294 | 1.4266 | 1.4225 | 1.4155 | 1.4127 | 1.4086 |
With the US session now active, USD/CAD trades at 1.4166 (-0.12% vs. yesterday's close), just 0.94% below its 52-week high of 1.4299. Today's intraday range of 1.4162–1.4198 (0.0036 pips) is above the average daily range. The intraday bias is neutral-to-bearish while price holds below the daily pivot at 1.4197.
Price is closest to S1 at 1.4155 — a decisive break below S1 (1.4155) exposes S2 (1.4127). The R1–S1 corridor (1.4225–1.4155) defines the equilibrium zone for the afternoon session; a sustained directional break will likely set the tone into tomorrow's Asian open.
For USD/CAD, upside momentum is intact; the 52W high is the key target on a sustained break above R2. The 52-week range of 1.3480–1.4299 places the pair at the 84th percentile annually. Key risk: any USD-moving headline into the NY close could extend the intraday range well beyond current pivot boundaries.
USD/CADRangeboundNear 52W High
📚 Book Insights
If You Believe Markets Are Efficient, Do Not Read This
A practitioner's guide to structural market inefficiencies — how central bank policy divergence, carry dynamics, and cross-asset flows create durable FX trading edges that efficient-market theorists systematically underestimate.
Read the analysis →Cross Pairs
EUR/GBP
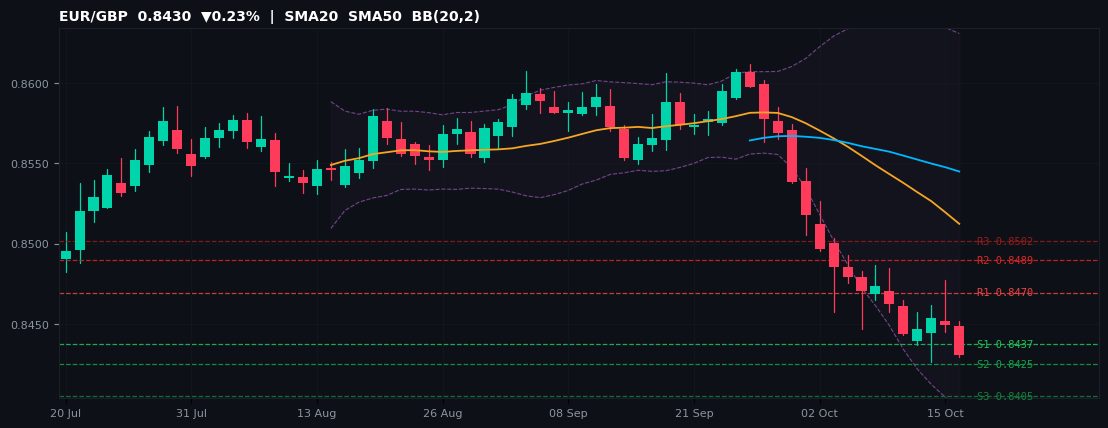
0.8430 ▼0.23% Day H 0.8452 / L 0.8430 52W 0.8426–0.8865
| R3 | R2 | R1 | S1 | S2 | S3 |
|---|---|---|---|---|---|
| 0.8502 | 0.8489 | 0.8470 | 0.8437 | 0.8425 | 0.8405 |
With the US session now active, EUR/GBP trades at 0.8430 (-0.23% vs. yesterday's close), just 0.05% above its 52-week floor at 0.8426. Today's intraday range of 0.8430–0.8452 (0.0022 pips) is above the average daily range. The intraday bias is neutral-to-bearish while price holds below the daily pivot at 0.8457.
Price is closest to S1 at 0.8437 — a decisive break below S1 (0.8437) exposes S2 (0.8425). The R1–S1 corridor (0.8470–0.8437) defines the equilibrium zone for the afternoon session; a sustained directional break will likely set the tone into tomorrow's Asian open.
For EUR/GBP, the annual support remains the decisive level — bulls need a firm hold here to prevent a deeper pullback. The 52-week range of 0.8426–0.8865 places the pair at the 1th percentile annually. Key risk: any USD-moving headline into the NY close could extend the intraday range well beyond current pivot boundaries.
EUR/GBPRangeboundBelow S1Near 52W Low
EUR/JPY
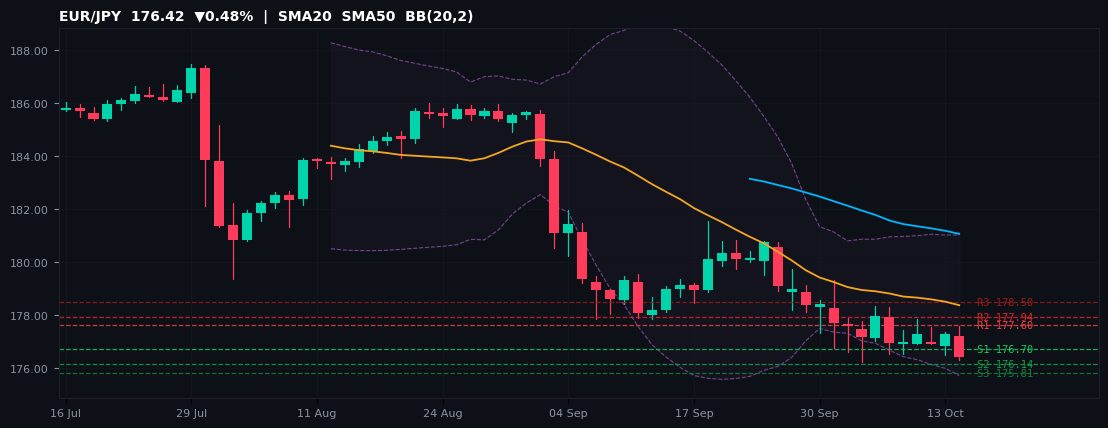
176.42 ▼0.48% Day H 177.58 / L 176.28 52W 175.70–187.94
| R3 | R2 | R1 | S1 | S2 | S3 |
|---|---|---|---|---|---|
| 178.50 | 177.94 | 177.60 | 176.70 | 176.14 | 175.81 |
With the US session now active, EUR/JPY trades at 176.42 (-0.48% vs. yesterday's close), just 0.41% above its 52-week floor at 175.70. Today's intraday range of 176.28–177.58 (1.30 pips) is above the average daily range. The intraday bias is neutral-to-bearish while price holds below the daily pivot at 177.04.
Price is closest to S1 at 176.70 — a decisive break below S1 (176.70) exposes S2 (176.14). The R1–S1 corridor (177.60–176.70) defines the equilibrium zone for the afternoon session; a sustained directional break will likely set the tone into tomorrow's Asian open.
For EUR/JPY, the annual support remains the decisive level — bulls need a firm hold here to prevent a deeper pullback. The 52-week range of 175.70–187.94 places the pair at the 6th percentile annually. Key risk: any USD-moving headline into the NY close could extend the intraday range well beyond current pivot boundaries.
EUR/JPYBearishBelow S1Near 52W Low
GBP/JPY
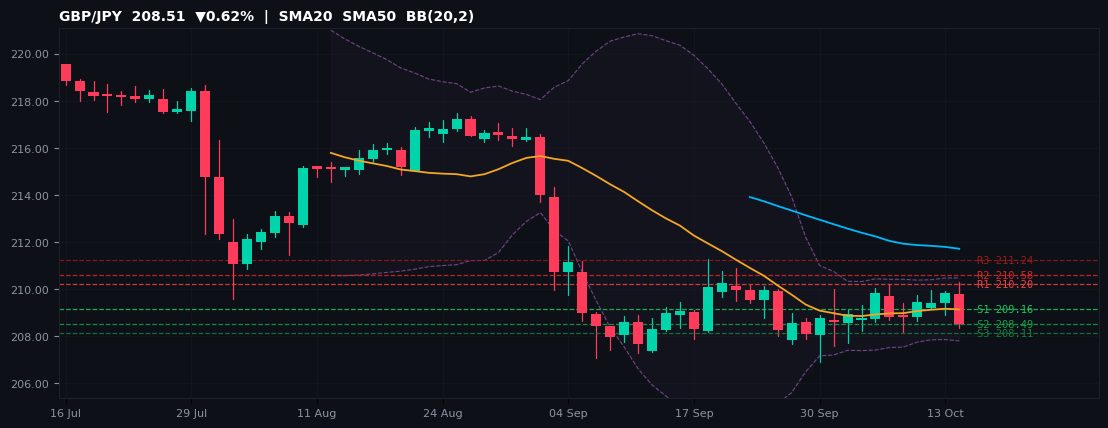
208.51 ▼0.62% Day H 210.30 / L 208.35 52W 199.06–219.60
| R3 | R2 | R1 | S1 | S2 | S3 |
|---|---|---|---|---|---|
| 211.24 | 210.58 | 210.20 | 209.16 | 208.49 | 208.11 |
With the US session now active, GBP/JPY trades at 208.51 (-0.62% vs. yesterday's close), at the 46th percentile of its 199.06–219.60 52-week range. Today's intraday range of 208.35–210.30 (1.95 pips) is above the average daily range. The intraday bias is neutral-to-bearish while price holds below the daily pivot at 209.54.
Price is closest to S1 at 209.16 — a decisive break below S1 (209.16) exposes S2 (208.49). The R1–S1 corridor (210.20–209.16) defines the equilibrium zone for the afternoon session; a sustained directional break will likely set the tone into tomorrow's Asian open.
For GBP/JPY, price is in the lower half of its annual range, keeping the path of least resistance lower. The 52-week range of 199.06–219.60 places the pair at the 46th percentile annually. Key risk: any USD-moving headline into the NY close could extend the intraday range well beyond current pivot boundaries.
GBP/JPYBearishBelow S1
AUD/JPY
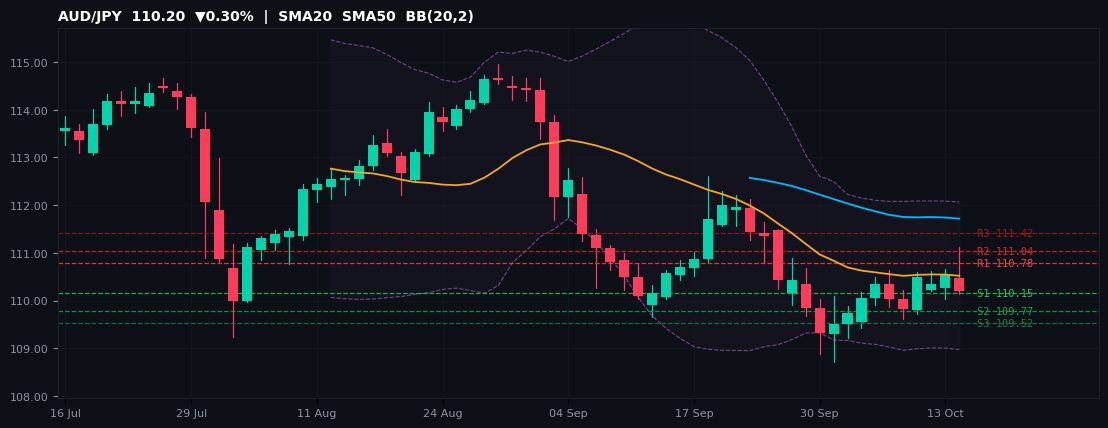
110.20 ▼0.30% Day H 111.12 / L 110.13 52W 98.82–114.95
| R3 | R2 | R1 | S1 | S2 | S3 |
|---|---|---|---|---|---|
| 111.42 | 111.04 | 110.78 | 110.15 | 109.77 | 109.52 |
With the US session now active, AUD/JPY trades at 110.20 (-0.30% vs. yesterday's close), at the 71th percentile of its 98.82–114.95 52-week range. Today's intraday range of 110.13–111.12 (0.99 pips) is above the average daily range. The intraday bias is neutral-to-bearish while price holds below the daily pivot at 110.40.
Price is closest to S1 at 110.15 — a decisive break below S1 (110.15) exposes S2 (109.77). The R1–S1 corridor (110.78–110.15) defines the equilibrium zone for the afternoon session; a sustained directional break will likely set the tone into tomorrow's Asian open.
For AUD/JPY, intraday momentum is constructive; the upper half of the annual range favours dip-buyers. The 52-week range of 98.82–114.95 places the pair at the 71th percentile annually. Key risk: any USD-moving headline into the NY close could extend the intraday range well beyond current pivot boundaries.
AUD/JPYBearish
🏭 Forex Course — Quick Quiz
Test Your Knowledge on Today's Key Themes
Five questions on carry trade dynamics, central bank divergence, commodity-currency correlations and technical extremes. Instant results, mobile-friendly.
Start the Quiz →Nordic Pairs
USD/NOK
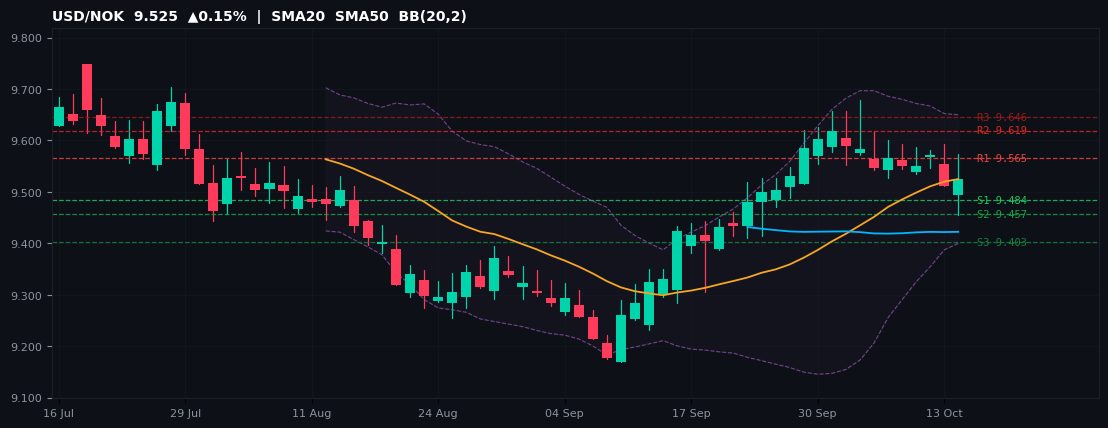
9.525 ▲0.15% Day H 9.574 / L 9.455 52W 9.144–10.297
| R3 | R2 | R1 | S1 | S2 | S3 |
|---|---|---|---|---|---|
| 9.646 | 9.619 | 9.565 | 9.484 | 9.457 | 9.403 |
With the US session now active, USD/NOK trades at 9.525 (+0.15% vs. yesterday's close), at the 33th percentile of its 9.144–10.297 52-week range. Today's intraday range of 9.455–9.574 (0.119 pips) is above the average daily range. The intraday bias is neutral-to-bearish while price holds below the daily pivot at 9.538.
Price is closest to R1 at 9.565 — a decisive break above R1 (9.565) opens R2 (9.619). The R1–S1 corridor (9.565–9.484) defines the equilibrium zone for the afternoon session; a sustained directional break will likely set the tone into tomorrow's Asian open.
For USD/NOK, price is in the lower half of its annual range, keeping the path of least resistance lower. The 52-week range of 9.144–10.297 places the pair at the 33th percentile annually. Key risk: any USD-moving headline into the NY close could extend the intraday range well beyond current pivot boundaries.
USD/NOKRangebound
USD/SEK
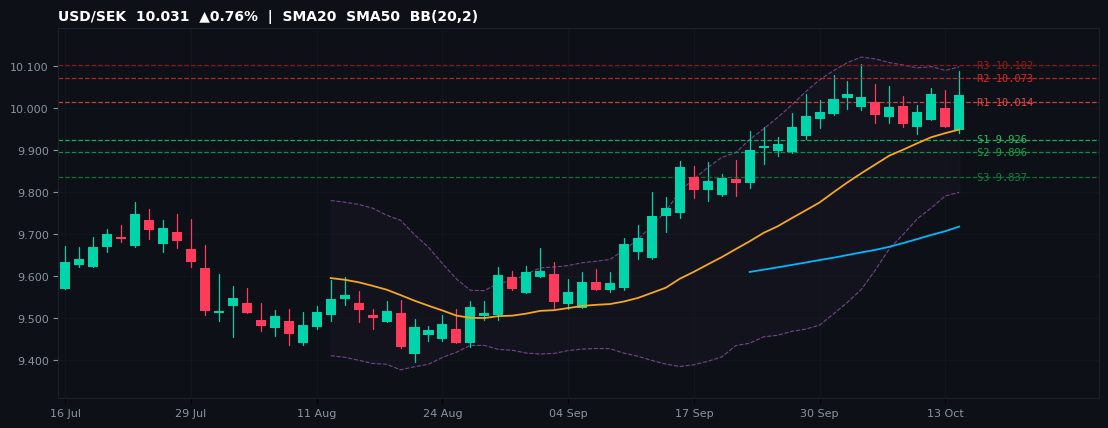
10.031 ▲0.76% Day H 10.090 / L 9.942 52W 8.737–10.105
| R3 | R2 | R1 | S1 | S2 | S3 |
|---|---|---|---|---|---|
| 10.102 | 10.073 | 10.014 | 9.926 | 9.896 | 9.837 |
With the US session now active, USD/SEK trades at 10.031 (+0.76% vs. yesterday's close), just 0.74% below its 52-week high of 10.105. Today's intraday range of 9.942–10.090 (0.148 pips) is above the average daily range. The intraday bias tilts bullish with price above the daily pivot at 9.985.
Price is closest to R1 at 10.014 — a decisive break above R1 (10.014) opens R2 (10.073). The R1–S1 corridor (10.014–9.926) defines the equilibrium zone for the afternoon session; a sustained directional break will likely set the tone into tomorrow's Asian open.
For USD/SEK, upside momentum is intact; the 52W high is the key target on a sustained break above R2. The 52-week range of 8.737–10.105 places the pair at the 95th percentile annually. Key risk: any USD-moving headline into the NY close could extend the intraday range well beyond current pivot boundaries.
USD/SEKBullishAbove R1Near 52W High
EUR/NOK
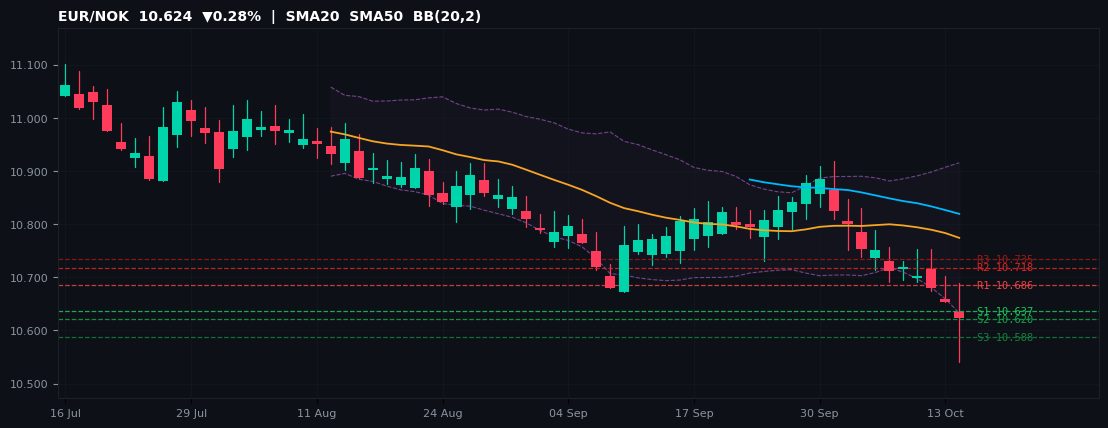
10.624 ▼0.28% Day H 10.689 / L 10.540 52W 10.540–12.012
| R3 | R2 | R1 | S1 | S2 | S3 |
|---|---|---|---|---|---|
| 10.735 | 10.718 | 10.686 | 10.637 | 10.620 | 10.588 |
With the US session now active, EUR/NOK trades at 10.624 (-0.28% vs. yesterday's close), just 0.80% above its 52-week floor at 10.540. Today's intraday range of 10.540–10.689 (0.149 pips) is above the average daily range. The intraday bias is neutral-to-bearish while price holds below the daily pivot at 10.669.
Price is closest to S1 at 10.637 — a decisive break below S1 (10.637) exposes S2 (10.620). The R1–S1 corridor (10.686–10.637) defines the equilibrium zone for the afternoon session; a sustained directional break will likely set the tone into tomorrow's Asian open.
For EUR/NOK, the annual support remains the decisive level — bulls need a firm hold here to prevent a deeper pullback. The 52-week range of 10.540–12.012 places the pair at the 6th percentile annually. Key risk: any USD-moving headline into the NY close could extend the intraday range well beyond current pivot boundaries.
EUR/NOKRangeboundBelow S1Near 52W Low
NOK/SEK
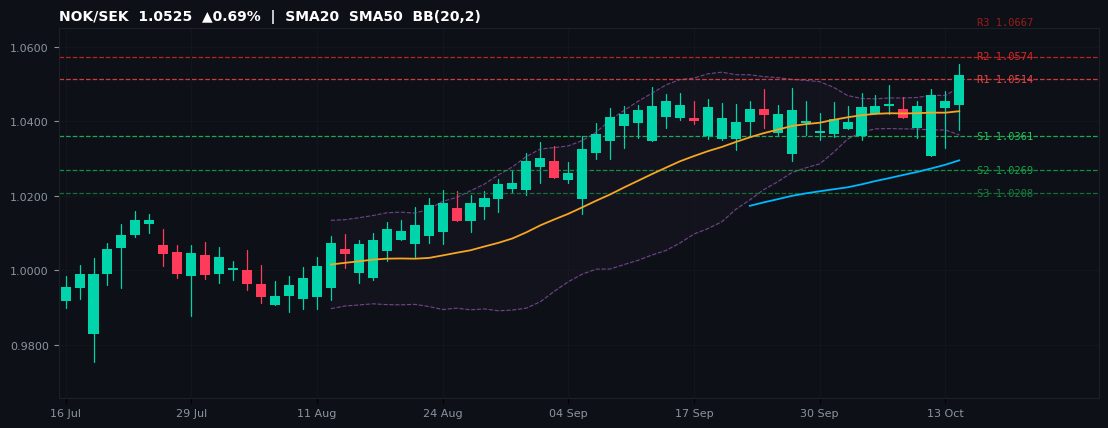
1.0525 ▲0.69% Day H 1.0554 / L 1.0377 52W 0.9064–1.0554
| R3 | R2 | R1 | S1 | S2 | S3 |
|---|---|---|---|---|---|
| 1.0667 | 1.0574 | 1.0514 | 1.0361 | 1.0269 | 1.0208 |
With the US session now active, NOK/SEK trades at 1.0525 (+0.69% vs. yesterday's close), just 0.27% below its 52-week high of 1.0554. Today's intraday range of 1.0377–1.0554 (0.0177 pips) is above the average daily range. The intraday bias tilts bullish with price above the daily pivot at 1.0421.
Price is closest to R1 at 1.0514 — a decisive break above R1 (1.0514) opens R2 (1.0574). The R1–S1 corridor (1.0514–1.0361) defines the equilibrium zone for the afternoon session; a sustained directional break will likely set the tone into tomorrow's Asian open.
For NOK/SEK, upside momentum is intact; the 52W high is the key target on a sustained break above R2. The 52-week range of 0.9064–1.0554 places the pair at the 98th percentile annually. Key risk: any USD-moving headline into the NY close could extend the intraday range well beyond current pivot boundaries.
NOK/SEKBullishAbove R1Near 52W High
Exotic Pairs
USD/TRY
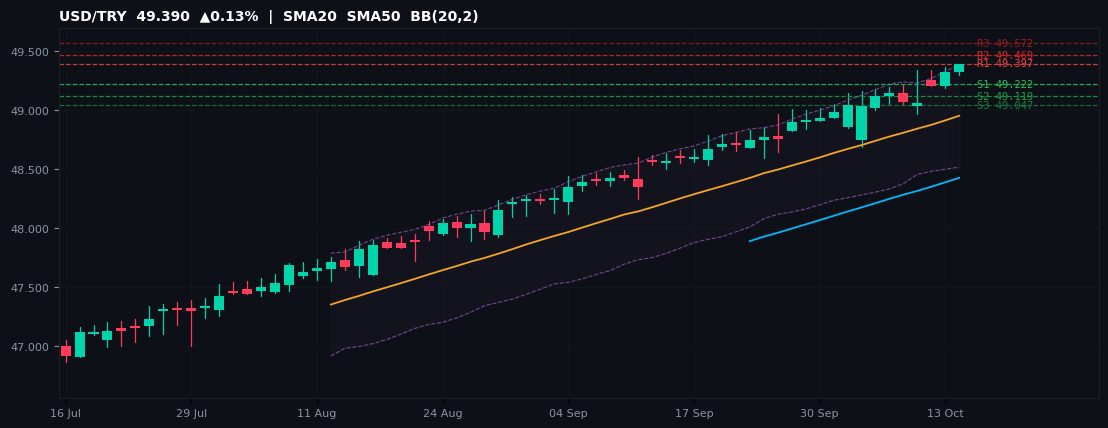
49.390 ▲0.13% Day H 49.391 / L 49.298 52W 41.648–49.391
| R3 | R2 | R1 | S1 | S2 | S3 |
|---|---|---|---|---|---|
| 49.572 | 49.469 | 49.397 | 49.222 | 49.119 | 49.047 |
With the US session now active, USD/TRY trades at 49.390 (+0.13% vs. yesterday's close), just 0.00% below its 52-week high of 49.391. Today's intraday range of 49.298–49.391 (0.093 pips) is above the average daily range. The intraday bias tilts bullish with price above the daily pivot at 49.294.
Price is closest to R1 at 49.397 — a decisive break above R1 (49.397) opens R2 (49.469). The R1–S1 corridor (49.397–49.222) defines the equilibrium zone for the afternoon session; a sustained directional break will likely set the tone into tomorrow's Asian open.
For USD/TRY, upside momentum is intact; the 52W high is the key target on a sustained break above R2. The 52-week range of 41.648–49.391 places the pair at the 100th percentile annually. Key risk: any USD-moving headline into the NY close could extend the intraday range well beyond current pivot boundaries.
USD/TRYRangeboundNear 52W High
USD/MXN
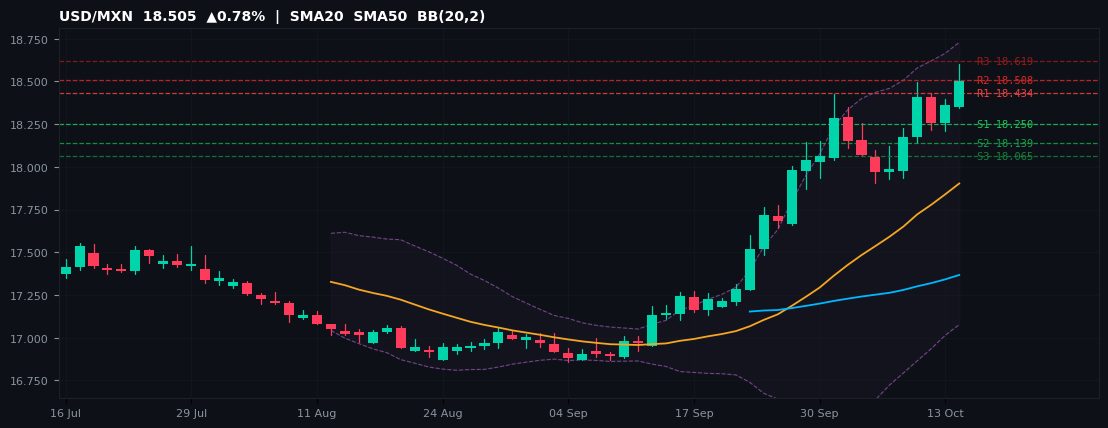
18.505 ▲0.78% Day H 18.601 / L 18.347 52W 16.855–18.768
| R3 | R2 | R1 | S1 | S2 | S3 |
|---|---|---|---|---|---|
| 18.619 | 18.508 | 18.434 | 18.250 | 18.139 | 18.065 |
With the US session now active, USD/MXN trades at 18.505 (+0.78% vs. yesterday's close), just 1.42% below its 52-week high of 18.768. Today's intraday range of 18.347–18.601 (0.253 pips) is above the average daily range. The intraday bias tilts bullish with price above the daily pivot at 18.323.
Price is closest to R1 at 18.434 — a decisive break above R1 (18.434) opens R2 (18.508). The R1–S1 corridor (18.434–18.250) defines the equilibrium zone for the afternoon session; a sustained directional break will likely set the tone into tomorrow's Asian open.
For USD/MXN, upside momentum is intact; the 52W high is the key target on a sustained break above R2. The 52-week range of 16.855–18.768 places the pair at the 86th percentile annually. Key risk: any USD-moving headline into the NY close could extend the intraday range well beyond current pivot boundaries.
USD/MXNBullishAbove R1Near 52W High
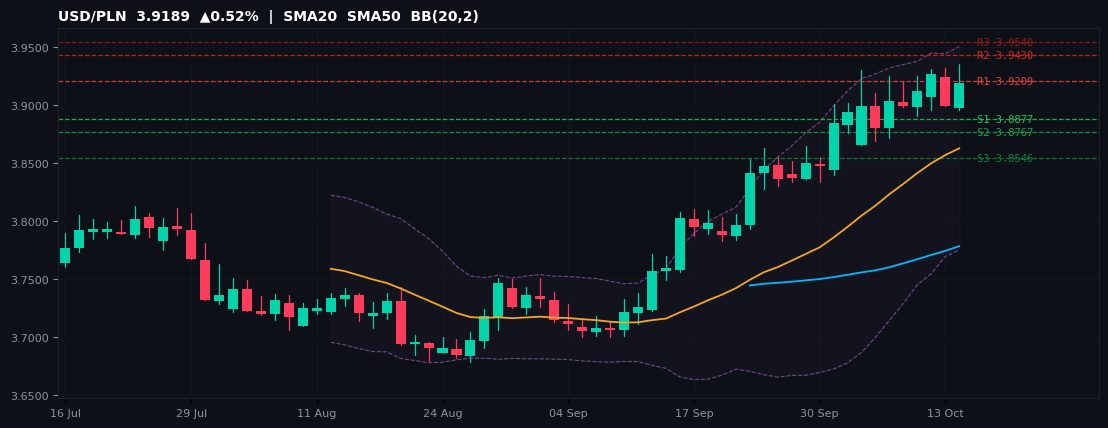
USD/PLN
3.9189 ▲0.52% Day H 3.9350 / L 3.8957 52W 3.4750–3.9350
| R3 | R2 | R1 | S1 | S2 | S3 |
|---|---|---|---|---|---|
| 3.9540 | 3.9430 | 3.9209 | 3.8877 | 3.8767 | 3.8546 |
With the US session now active, USD/PLN trades at 3.9189 (+0.52% vs. yesterday's close), just 0.41% below its 52-week high of 3.9350. Today's intraday range of 3.8957–3.9350 (0.0393 pips) is above the average daily range. The intraday bias tilts bullish with price above the daily pivot at 3.9098.
Price is closest to R1 at 3.9209 — a decisive break above R1 (3.9209) opens R2 (3.9430). The R1–S1 corridor (3.9209–3.8877) defines the equilibrium zone for the afternoon session; a sustained directional break will likely set the tone into tomorrow's Asian open.
For USD/PLN, upside momentum is intact; the 52W high is the key target on a sustained break above R2. The 52-week range of 3.4750–3.9350 places the pair at the 96th percentile annually. Key risk: any USD-moving headline into the NY close could extend the intraday range well beyond current pivot boundaries.
USD/PLNBullishNear 52W High
Informational purposes only — not investment advice. Pivot levels computed from yesterday's session OHLC via standard floor-pivot formula. Prices sourced from MetaTrader 5 as of Friday 16 October 2026 midday (15:30 CET). Past performance is not indicative of future results.