USD/SGD: Down 0.55% to 1.2790 — Ascending Channel
MarketsFN Team
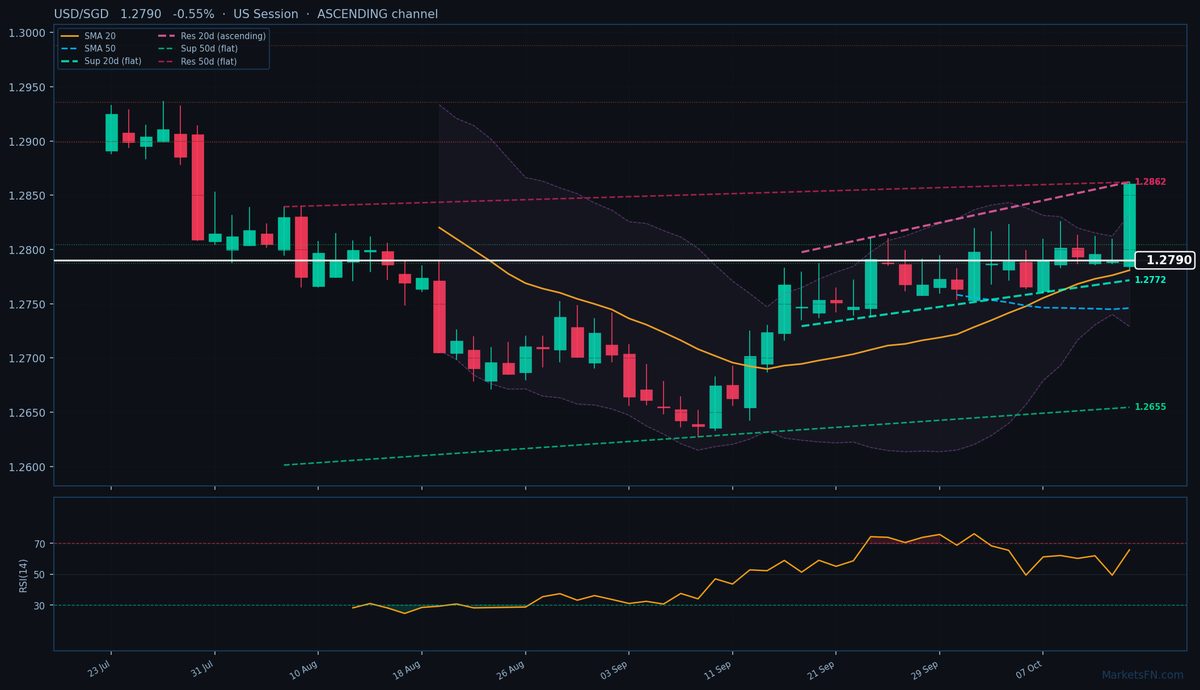
USD/SGD: Down 0.55% to 1.2790 — Ascending Channel
Published: October 16, 2026 · MarketsFN Team · US Session · Emerging FX
| Pair | Rate | Change | RSI(14) | SMA-20 | SMA-50 | 52W High | 52W Low | Pivot | R1 | S1 |
|---|---|---|---|---|---|---|---|---|---|---|
| USD/SGD | 1.2790 | -0.55% | 65.8 | 1.2781 | 1.2746 | 1.3075 | 1.2595 | 1.2795 | 1.2803 | 1.2781 |
S/R Support & Resistance Levels
Dynamic Trendlines
| Level | Type | Direction | Distance |
|---|---|---|---|
| 1.2772 | 20d Support | flat (flat) | -0.14% / 18.3 pips |
| 1.2862 | 20d Resistance | up (ascending) | +0.56% / 72.2 pips |
| 1.2655 | 50d Support | flat (flat) | -1.06% / 135.4 pips |
| 1.2862 | 50d Resistance | flat (flat) | +0.56% / 72.1 pips |
Static Levels
| Level | Type | Touches | Distance |
|---|---|---|---|
| 1.2988 | Resistance | 2x | +0.99% / 127.6 pips |
| 1.2936 | Resistance | 2x | +0.59% / 75.4 pips |
| 1.2899 | Resistance | 2x | +0.30% / 38.6 pips |
| 1.2805 | Support | 3x | -0.43% / 55.9 pips |
| 1.2788 | Support | 2x | -0.57% / 72.8 pips |
USD/SGD is trading at 1.2790 (-0.55%), testing the upper bounds of its short-term bullish channel after breaking below yesterday’s close of 1.2860. The pair remains in an uptrend, trading above both the 20-day (1.2781) and 50-day (1.2746) SMAs, though today’s pullback suggests potential fatigue near the 20-day dynamic resistance at 1.2862 (+72.2 pips). The ascending 20-day channel (slope +0.01%) reinforces the bullish bias, with immediate dynamic support at 1.2772 (-18.3 pips, flat slope). A break below this level could signal a deeper retracement toward the 50-day dynamic support at 1.2655 (-135.4 pips), though the broader 50-day channel remains sideways.
Static levels highlight congestion zones: the nearest resistance cluster (R1) sits at 1.2899 (+109 pips), while support clusters loom at 1.2805 (-55.9 pips, S1) and 1.2788 (-72.8 pips, S2). The RSI at 65.8 is neutral but flirting with overbought territory, suggesting limited upside momentum unless fundamentals drive a fresh bid. With the ATR(14) at 0.0041, today’s range (1.2782–1.2862) aligns with recent volatility norms.
Short-term, the pair’s ability to hold above the 20-day SMA (1.2781) and pivot (1.2795) will dictate direction. A rebound toward 1.2862 resistance would reaffirm the uptrend, while a close below 1.2772 dynamic support could trigger profit-taking toward 1.2746 (50-day SMA). Watch for a confirmed break of either the 20-day dynamic resistance or support to gauge the next leg. The European session’s price action will test whether this dip is a buying opportunity or the start of a deeper correction.
Disclaimer
The content on MarketsFN.com is provided for educational and informational purposes only and does not constitute financial advice. All investments involve risk and past performance does not guarantee future results.