USD/THB: Down 0.83% to 33.3950 — Ascending Channel
MarketsFN Team
USD/THB: Down 0.83% to 33.3950 — Ascending Channel
Published: October 16, 2026 · MarketsFN Team · US Session · Emerging FX
| Pair | Rate | Change | RSI(14) | SMA-20 | SMA-50 | 52W High | 52W Low | Pivot | R1 | S1 |
|---|---|---|---|---|---|---|---|---|---|---|
| USD/THB | 33.3950 | -0.83% | 61.2 | 33.4465 | 33.1592 | 33.7470 | 30.5160 | 33.4513 | 33.6827 | 33.2657 |
S/R Support & Resistance Levels
Dynamic Trendlines
| Level | Type | Direction | Distance |
|---|---|---|---|
| 33.2606 | 20d Support | up (ascending) | -0.40% / 1343.9 pips |
| 33.8954 | 20d Resistance | up (ascending) | +1.50% / 5004.0 pips |
| 32.9712 | 50d Support | up (ascending) | -1.27% / 4238.1 pips |
| 33.8273 | 50d Resistance | up (ascending) | +1.29% / 4323.1 pips |
Static Levels
| Level | Type | Touches | Distance |
|---|---|---|---|
| 32.4945 | Support | 2x | -3.50% / 11785.0 pips |
| 32.4505 | Support | 2x | -3.63% / 12225.0 pips |
| 32.2535 | Support | 2x | -4.22% / 14195.0 pips |
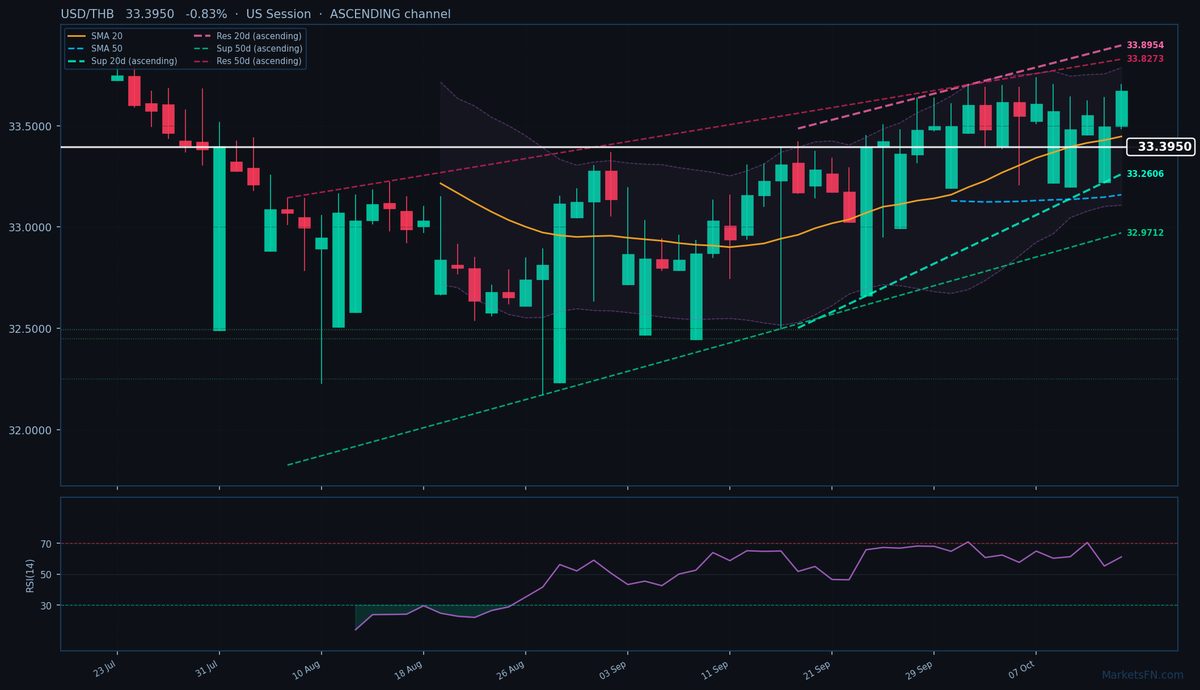
USD/THB is trading at 33.3950 (-0.83%), testing the lower bounds of its recent consolidation phase as it dips below the 20-day SMA (33.4465) while holding above the 50-day SMA (33.1592). This price action suggests near-term indecision, with the pair caught between two ascending dynamic channels — the 20-day support at 33.2606 (-1.22%, 1343.9 pips below) and resistance at 33.8954 (+0.66%, 5004.0 pips above), and the broader 50-day channel (support at 32.9712, resistance at 33.8273). The ascending slope of both channels indicates persistent but slowing bullish momentum, though today’s break below the 20-day SMA warns of potential near-term exhaustion.
Static levels show immediate pivot support at 33.2657 (S1, -129.3 pips) and resistance at 33.6827 (R1, +287.7 pips), framing a tight technical battleground. The RSI at 61.2 remains neutral, neither confirming nor contradicting today’s pullback. With ATR(14) at 0.3330, the day’s range (33.4840–33.7020) aligns with typical volatility, though the breach of the European session pivot (33.4513) suggests bearish intraday bias.
Short-term, the pair’s ability to reclaim the 20-day SMA will determine whether this is a healthy retracement within the ascending channel or the start of a deeper correction. A close below 33.2606 (20-day dynamic support) would signal trend weakness, while holding above 33.1592 (50-day SMA) maintains the broader uptrend. The next catalyst is the European-New York session handoff, where liquidity flows could test these key levels.
Disclaimer
The content on MarketsFN.com is provided for educational and informational purposes only and does not constitute financial advice. All investments involve risk and past performance does not guarantee future results.