GBP/USD: Up 0.01% to 1.3227 — Descending Channel
MarketsFN Team
GBP/USD: Up 0.01% to 1.3227 — Descending Channel
Published: October 09, 2026 · MarketsFN Team · US Session
| Pair | Rate | Change | RSI(14) | SMA-20 | SMA-50 | 52W High | 52W Low | Pivot | R1 | S1 |
|---|---|---|---|---|---|---|---|---|---|---|
| GBP/USD | 1.3227 | +0.01% | 36.2 | 1.3292 | 1.3436 | 1.3846 | 1.3019 | 1.3219 | 1.3254 | 1.3190 |
📊 Support & Resistance Levels
Dynamic Trendlines
| Level | Type | Direction | Distance |
|---|---|---|---|
| 1.3091 | 20d Support | ↘ descending | -1.03% / 136.0 pips |
| 1.3249 | 20d Resistance | ↘ descending | +0.17% / 22.7 pips |
| 1.3142 | 50d Support | ↘ descending | -0.64% / 84.2 pips |
| 1.3388 | 50d Resistance | ↘ descending | +1.22% / 161.4 pips |
Static Levels
| Level | Type | Touches | Distance |
|---|---|---|---|
| 1.3567 | Resistance | 2× | +2.57% / 340.5 pips |
| 1.3507 | Resistance | 2× | +2.12% / 280.2 pips |
| 1.3480 | Resistance | 2× | +1.92% / 253.6 pips |
| 1.3177 | Support | 2× | -0.37% / 49.2 pips |
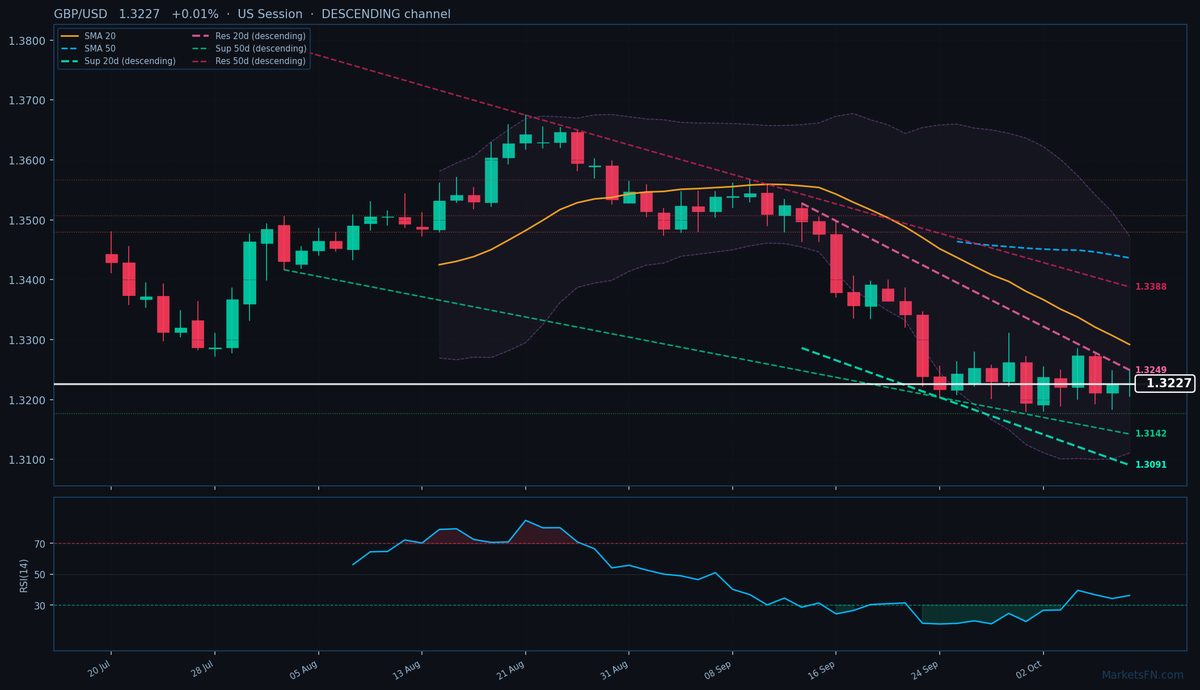
GBP/USD is trading at 1.3227 (+0.01%) as of October 09, 2026, during the US session, with a day range of 1.3205 – 1.3249. The currency pair remains below both the 20-day and 50-day Simple Moving Averages at 1.3292 and 1.3436, respectively, reinforcing the prevailing downtrend. The rate is currently positioned within a descending 20-day dynamic channel, with the nearest dynamic support trendline at 1.3091, 136.0 pips away, and the nearest dynamic resistance trendline at 1.3249, just 22.7 pips above the current price. The 50-day dynamic channel also indicates a downtrend, with support at 1.3142 (84.2 pips away) and resistance at 1.3388 (161.4 pips away).
The closest static support level, S1, is at 1.3177, a mere 49.2 pips below the current rate, while the nearest static resistance level, R1, is at 1.3480, 253.6 pips away. The RSI(14) stands at 36.2, indicating neutral territory and not signaling an oversold condition. Given the downtrend indicated by the moving averages and the descending dynamic channels, the short-term outlook remains bearish. The proximity to the dynamic resistance trendline at 1.3249, which was touched today at the high of 1.3249, may cap further upside. A break below S1 at 1.3177 could signal further downside, targeting the 20-day dynamic support trendline at 1.3091. The next catalyst for direction will be a break above the 20-day dynamic resistance trendline or below the S1 static support level.
Disclaimer
The content on MarketsFN.com is provided for educational and informational purposes only and does not constitute financial advice. All investments involve risk and past performance does not guarantee future results.