Fibonacci Nordic Pairs: EUR/DKK Close to 61.8% Level
MarketsFN Team
Fibonacci retracement analysis for six Nordic currency pairs on Wednesday, 14 October 2026. The Swedish krona (SEK), Norwegian krone (NOK) and Danish krone (DKK) against both the US dollar and the euro. Daily and 30-minute timeframes are shown for each pair with key levels at 23.6%, 38.2%, 50%, 61.8% and 78.6%.
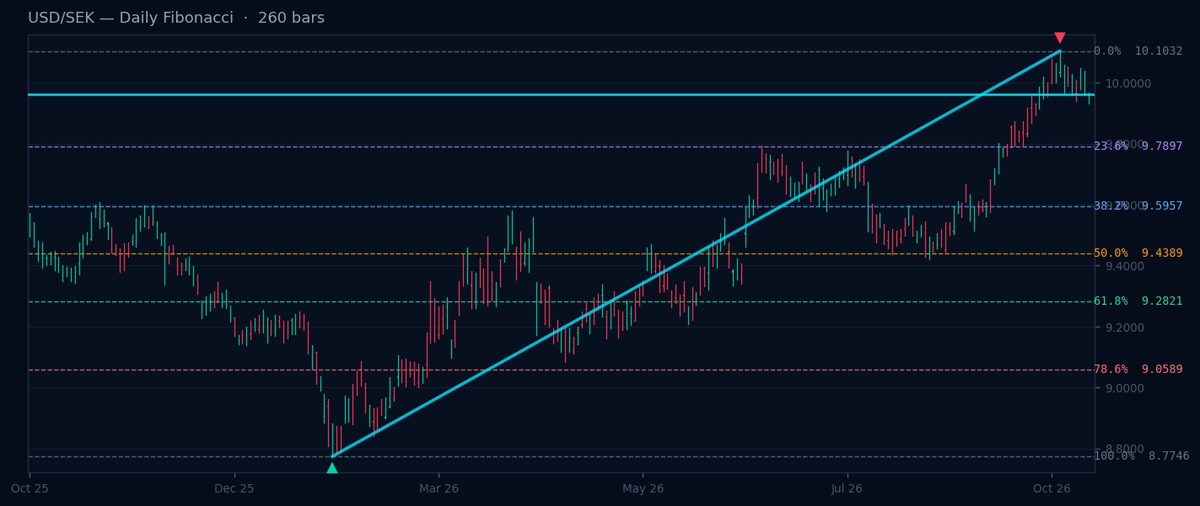
USD/SEK — Daily Fibonacci
Uptrend ↑ · Current: 9.9625
USD/SEK remains in a daily uptrend at 9.9625, retesting recent highs. Key Fibonacci supports are 38.2% (9.5957), 50.0% (9.4389), and 61.8% (9.2821), which may act as pullback zones. The pair's strength suggests dips toward these levels could attract buyers. A break below 9.2821 would challenge the bullish structure. Monitor price action near these Fib levels for potential reversals.
USD/SEK — 30-min Fibonacci
Downtrend ↓ · Current: 9.9625
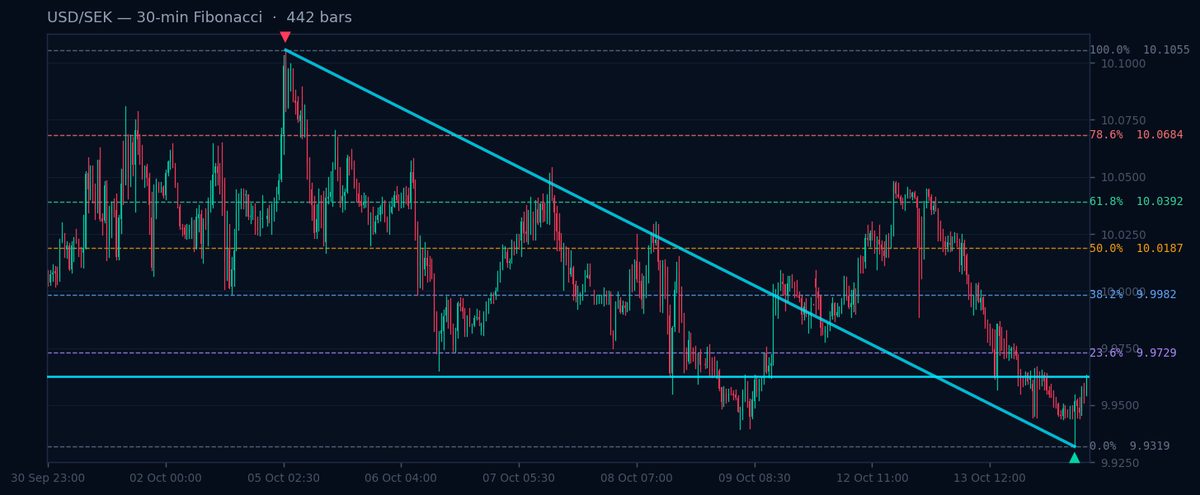
USD/SEK trades at 9.9625 in a 30-minute downtrend. Resistance levels are 61.8% (10.0392), 50.0% (10.0187), and 38.2% (9.9982). Sellers may dominate near these levels unless the pair reclaims 10.0187. A break above 10.0392 could signal a short-term reversal. Current price action favors selling into rallies toward Fib resistances.
USD/NOK — Daily Fibonacci
Downtrend ↓ · Current: 9.4924
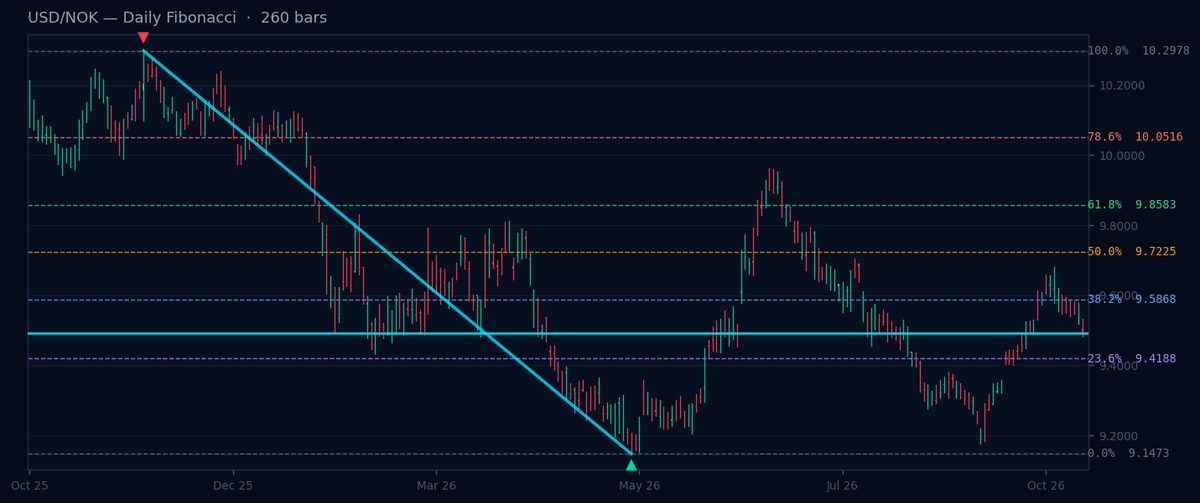
USD/NOK is in a daily downtrend at 9.4924. Key resistances are 61.8% (9.8583), 50.0% (9.7225), and 38.2% (9.5868). The bearish trend remains intact unless the pair breaks 9.8583. Sellers may target new lows below 9.1473. Watch for rejection near Fib levels to confirm downside continuation.
USD/NOK — 30-min Fibonacci
Downtrend ↓ · Current: 9.4924
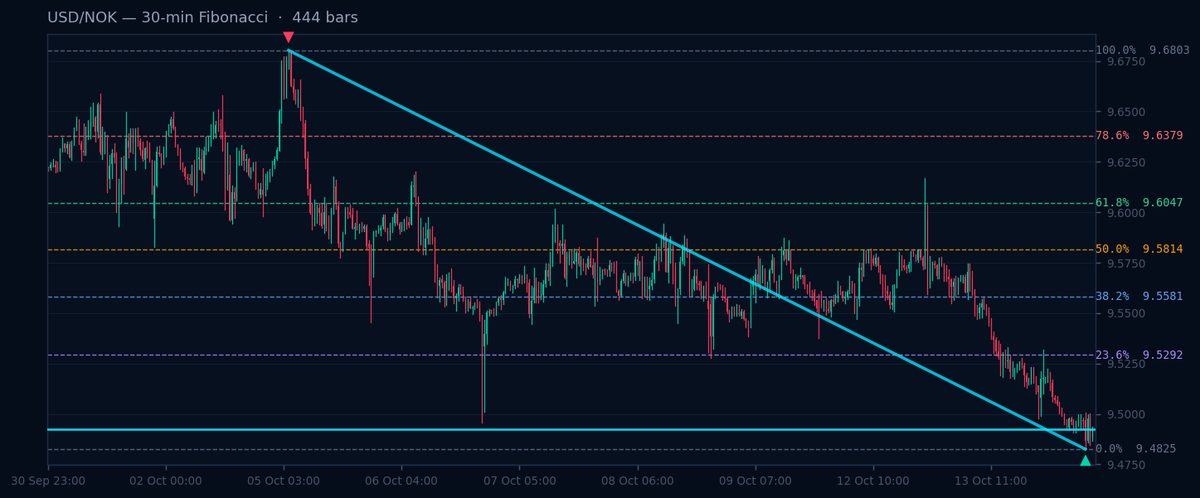
USD/NOK trades at 9.4924 in a 30-minute downtrend. Resistances are 61.8% (9.6047), 50.0% (9.5814), and 38.2% (9.5581). The pair shows weakness, with rallies likely capped near these levels. A break above 9.6047 could shift momentum. Until then, favor selling into strength near Fib resistances.
USD/DKK — Daily Fibonacci
Uptrend ↑ · Current: 6.6763
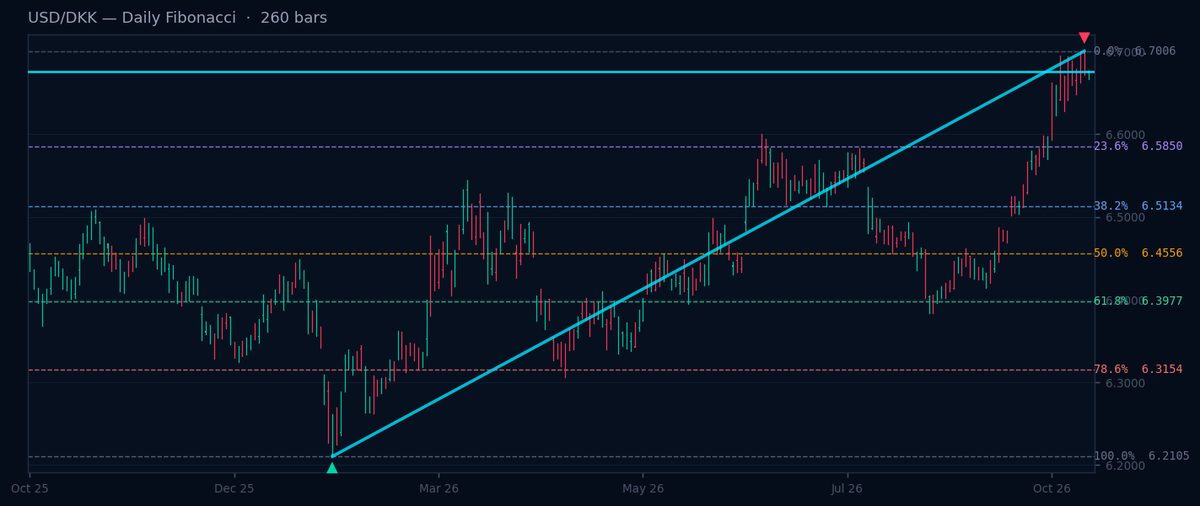
USD/DKK holds in a daily uptrend at 6.6763. Key supports are 38.2% (6.5134), 50.0% (6.4556), and 61.8% (6.3977). The bullish bias remains unless 6.3977 breaks. Buyers may step in near these Fib levels. A sustained move above 6.7006 could extend gains. Monitor pullbacks for potential long entries.
USD/DKK — 30-min Fibonacci
Uptrend ↑ · Current: 6.6763
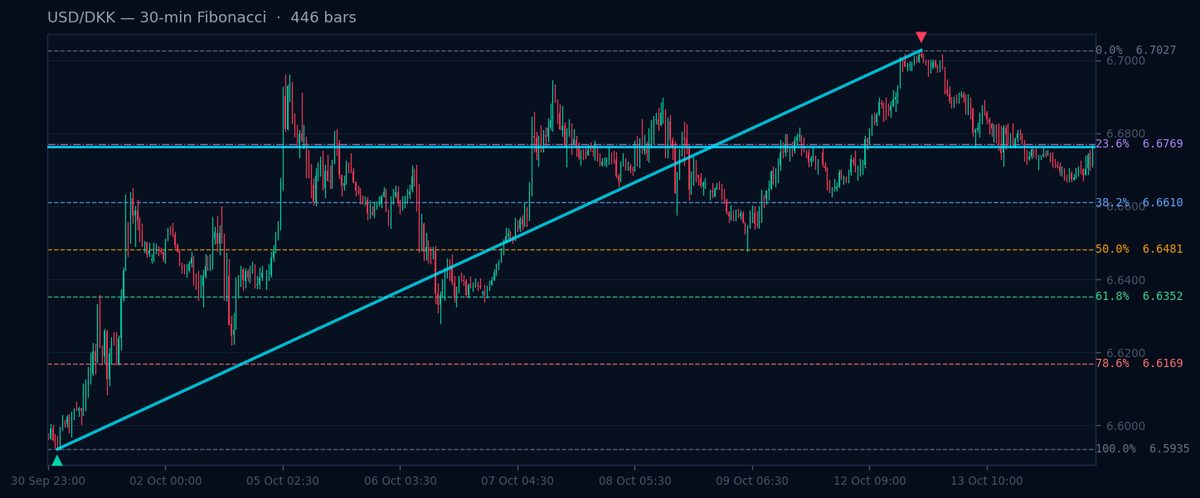
USD/DKK trades at 6.6763 in a 30-minute uptrend. Supports are 38.2% (6.661), 50.0% (6.6481), and 61.8% (6.6352). The pair remains bullish above 6.6352. A break below 6.6352 may signal a short-term reversal. Until then, dips toward Fib supports could attract buyers.
MarketsFN Tools
Explore Fibonacci Levels & Learn Forex Trading
Use our interactive Fibonacci Levels Tool to analyse any major forex pair in real time — daily or intraday — and accelerate your learning with our free Forex Trading Course.
EUR/SEK — Daily Fibonacci
Uptrend ↑ · Current: 11.1542
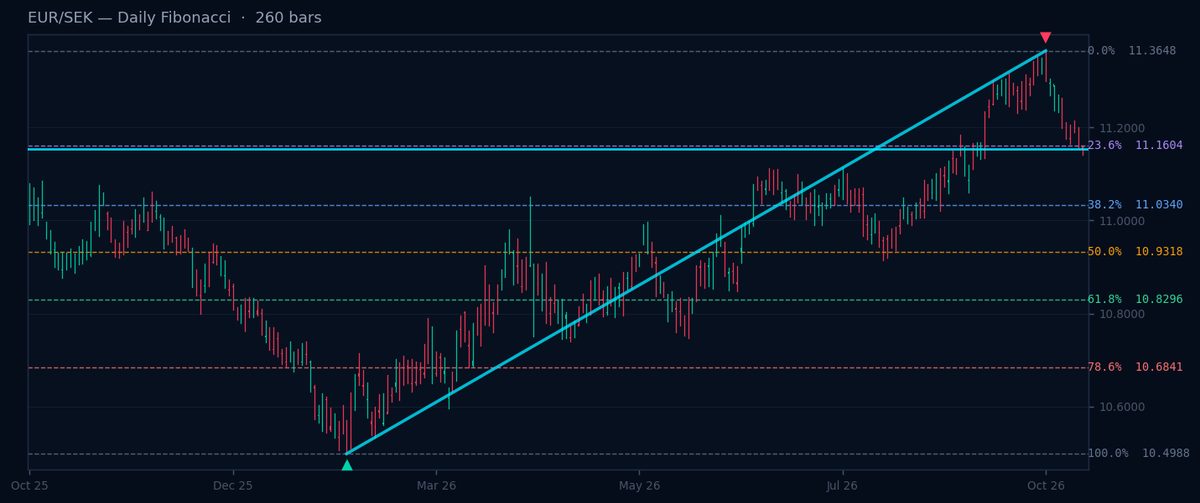
EUR/SEK is in a daily uptrend at 11.1542. Key supports are 38.2% (11.034), 50.0% (10.9318), and 61.8% (10.8296). The bullish trend holds unless 10.8296 breaks. Buyers may defend these levels. A break above 11.3648 could accelerate gains. Watch for reversals near Fib supports.
EUR/SEK — 30-min Fibonacci
Downtrend ↓ · Current: 11.1542
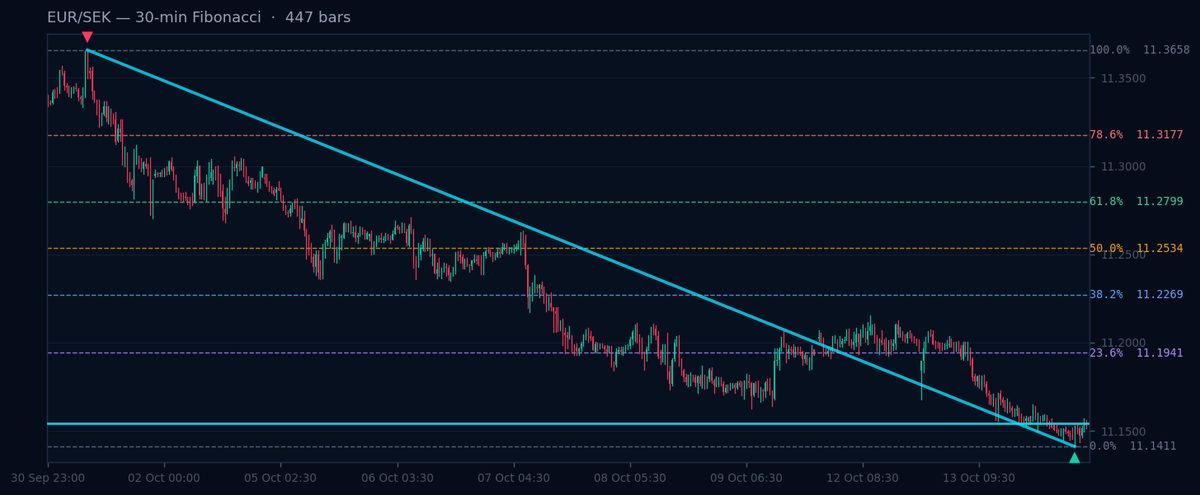
EUR/SEK trades at 11.1542 in a 30-minute downtrend. Resistances are 61.8% (11.2799), 50.0% (11.2534), and 38.2% (11.2269). Sellers dominate below 11.2269. A break above 11.2799 may shift momentum. Until then, rallies toward Fib resistances could offer short opportunities.
EUR/NOK — Daily Fibonacci
Downtrend ↓ · Current: 10.6276
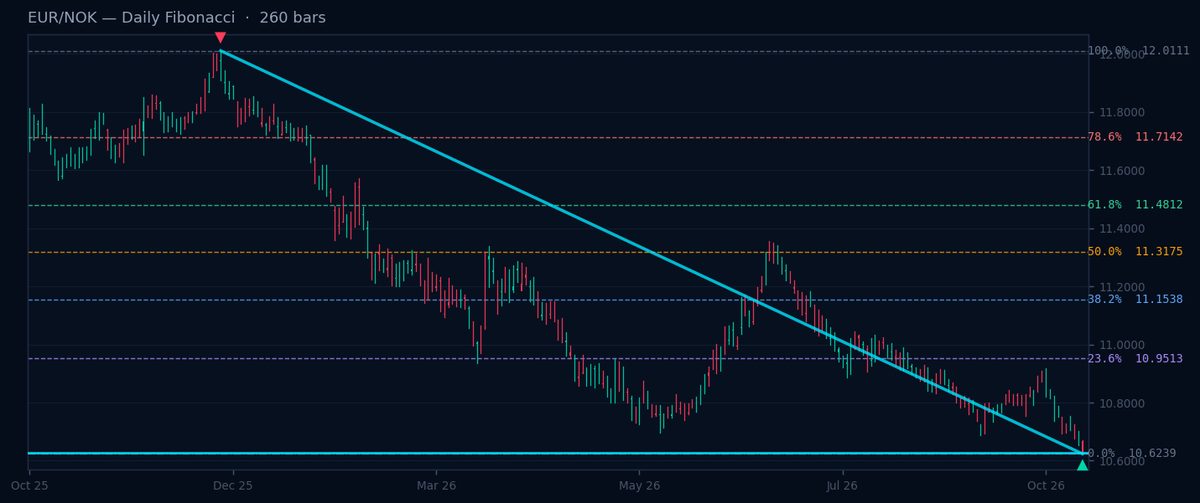
EUR/NOK is in a daily downtrend at 10.6276. Key resistances are 61.8% (11.4812), 50.0% (11.3175), and 38.2% (11.1538). The bearish trend persists below 11.1538. Sellers may target new lows. A break above 11.4812 is needed for a reversal. Watch for rejection near Fib resistances.
EUR/NOK — 30-min Fibonacci
Downtrend ↓ · Current: 10.6280
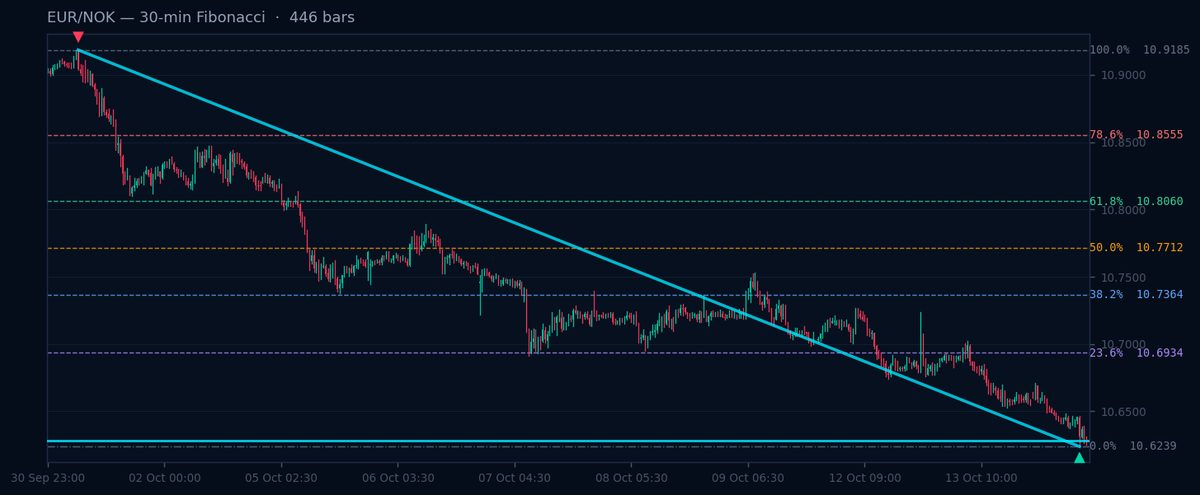
EUR/NOK trades at 10.628 in a 30-minute downtrend. Resistances are 61.8% (10.806), 50.0% (10.7712), and 38.2% (10.7364). The pair remains weak below 10.7364. A break above 10.806 could signal a reversal. Until then, rallies toward Fib resistances may attract sellers.
EUR/DKK — Daily Fibonacci
Uptrend ↑ · Current: 7.4753
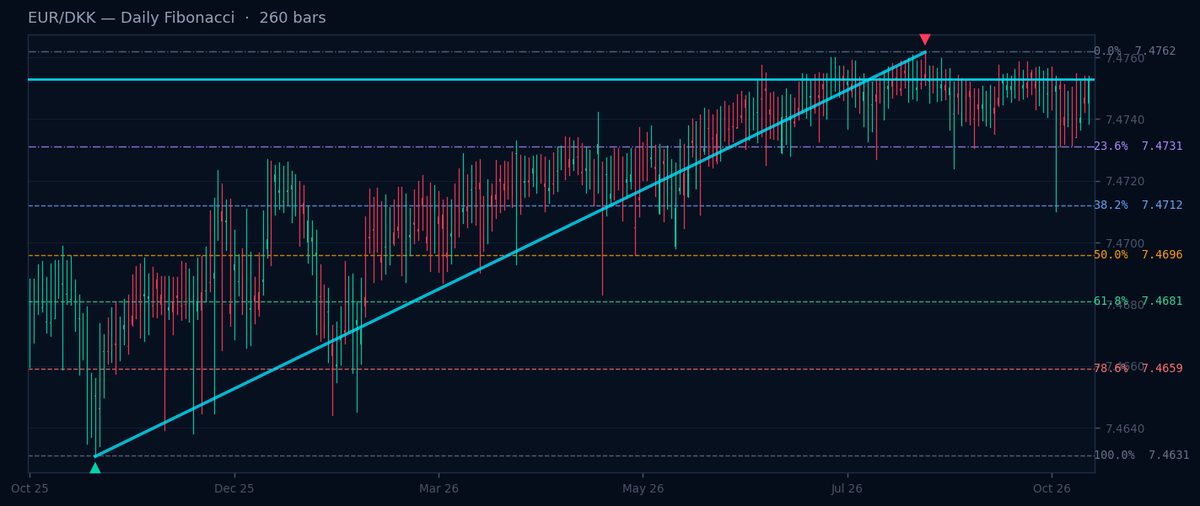
EUR/DKK is in a tight daily uptrend at 7.4753. Key supports are 38.2% (7.4712), 50.0% (7.4696), and 61.8% (7.4681). The bullish bias holds above 7.4681. A break below 7.4681 may signal a reversal. Watch for dips toward Fib supports for potential long entries.
EUR/DKK — 30-min Fibonacci
Uptrend ↑ · Current: 7.4753
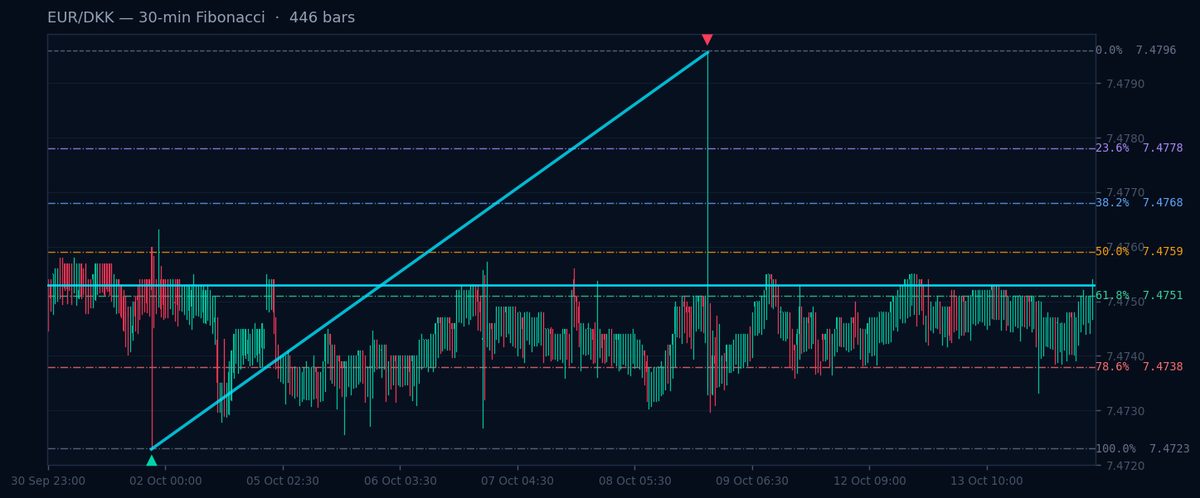
EUR/DKK trades at 7.4753 in a 30-minute uptrend. Supports are 38.2% (7.4768), 50.0% (7.4759), and 61.8% (7.4751). The pair remains bullish above 7.4751. A break below 7.4751 may indicate short-term weakness. Until then, dips toward Fib supports could attract buyers.
Dashboard
Insider Trading
Track real-time SEC Form 4 filings — see what company insiders are buying and selling.
Dashboard
Hedge Funds 13F Tracker
Monitor quarterly 13F filings — discover what the world's top hedge funds are holding.
Disclaimer
This article is for educational and informational purposes only and does not constitute financial advice or a recommendation to buy or sell any financial instrument. Fibonacci retracement levels are technical analysis tools used to identify potential support and resistance zones. All trading involves risk, including the possible loss of principal. Past performance is no guarantee of future results. You are solely responsible for your own investment decisions.