Fibonacci Daily G7 Pairs: USD/JPY Close to 38.2% Level
MarketsFN Team
Fibonacci retracement analysis for the seven major G7 forex pairs on Wednesday, 14 October 2026. Each pair is covered on two timeframes — the full daily trend for a longer-term view and the 30-minute intraday picture. Key levels at 23.6%, 38.2%, 50%, 61.8% and 78.6% mark potential support and resistance zones.
EUR/USD — Daily Fibonacci
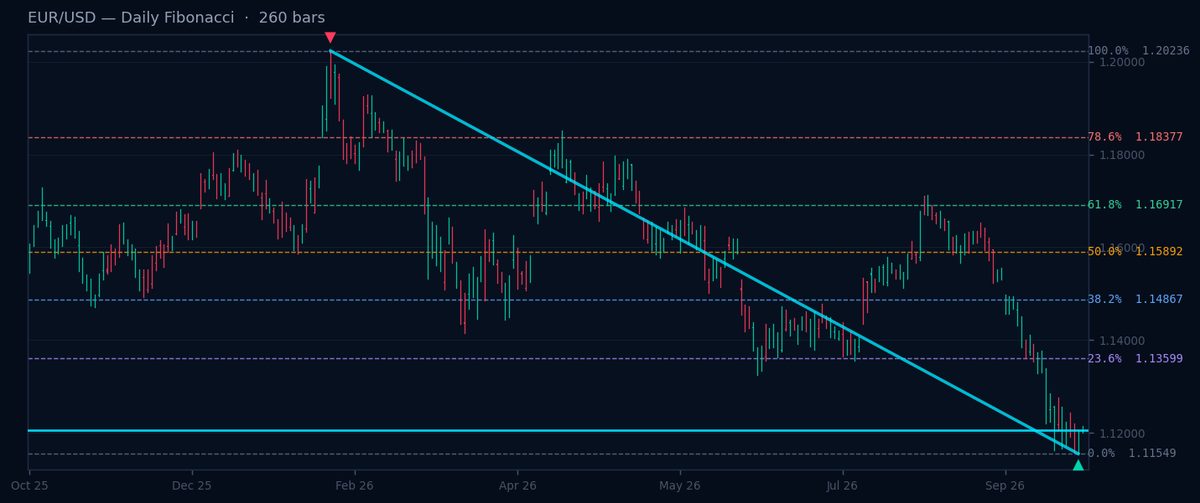
Downtrend ↓ · Current: 1.12057
EUR/USD is in a downtrend, currently trading at 1.12057. Key Fibonacci resistance levels are 1.16917 (61.8%), 1.15892 (50.0%), and 1.14867 (38.2%). The pair faces selling pressure, with the 61.8% level acting as a strong barrier. A break above 1.14867 could signal a short-term reversal, but the overall trend remains bearish. Watch for rejection near these levels to confirm continuation.
GBP/USD — Daily Fibonacci
Uptrend ↑ · Current: 1.32612
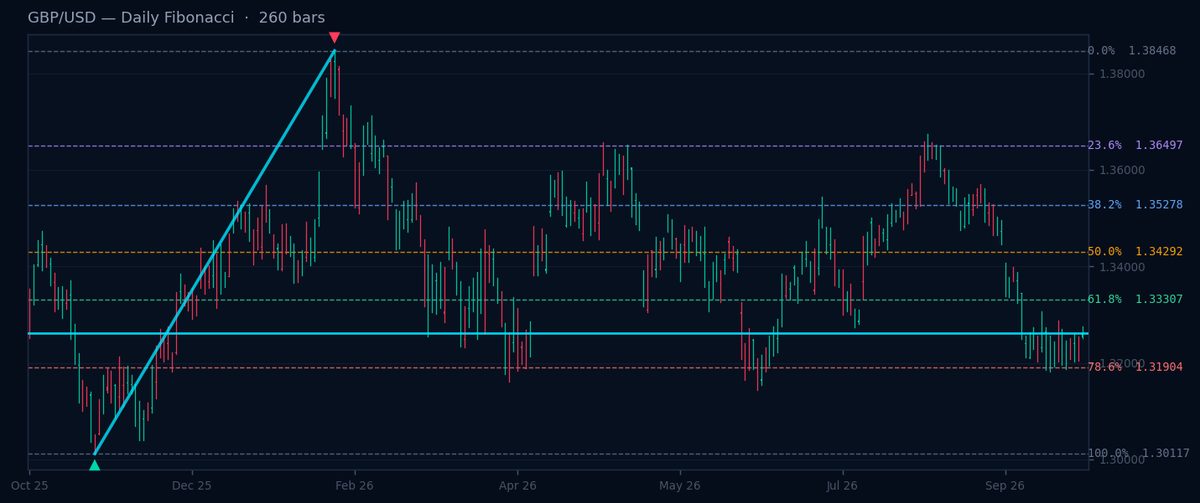
GBP/USD is in an uptrend, currently at 1.32612. Key Fibonacci resistance levels are 1.35278 (38.2%), 1.34292 (50.0%), and 1.33307 (61.8%). The pair shows bullish momentum, with the 38.2% level as the next target. A break above 1.35278 could extend gains, while failure may trigger a pullback. The 50.0% level offers interim resistance.
USD/JPY — Daily Fibonacci
Uptrend ↑ · Current: 158.370
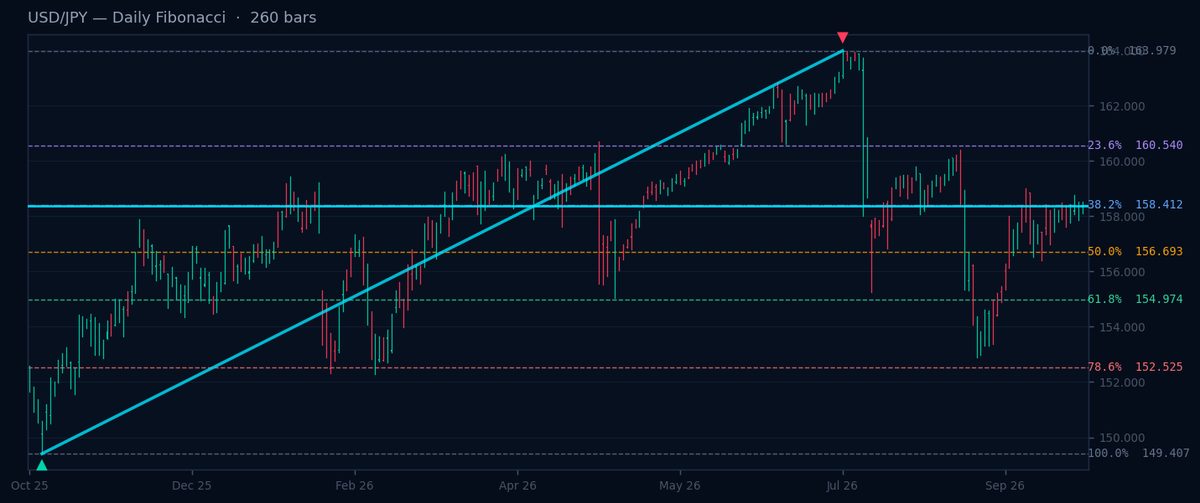
USD/JPY is in an uptrend, trading at 158.37, near the 38.2% level at 158.412. Key support levels are 156.693 (50.0%) and 154.974 (61.8%). The pair remains bullish, with the 38.2% level acting as a pivot. A hold above 158.412 could target higher, while a break below 156.693 may signal a correction.
MarketsFN Tools
Explore Fibonacci Levels & Learn Forex Trading
Use our interactive Fibonacci Levels Tool to analyse any major forex pair in real time — daily or intraday — and accelerate your learning with our free Forex Trading Course.
USD/CHF — Daily Fibonacci
Uptrend ↑ · Current: 0.83291
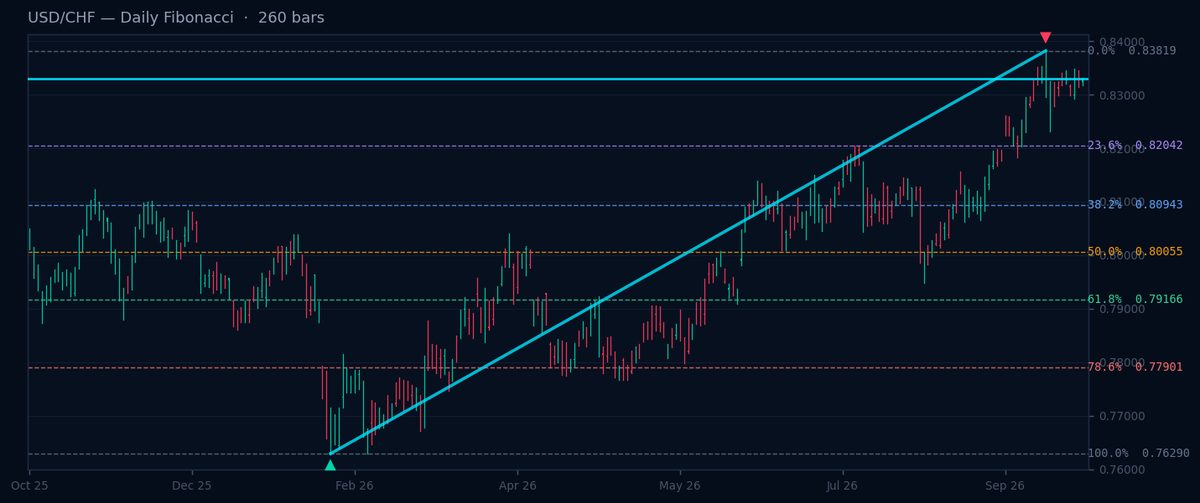
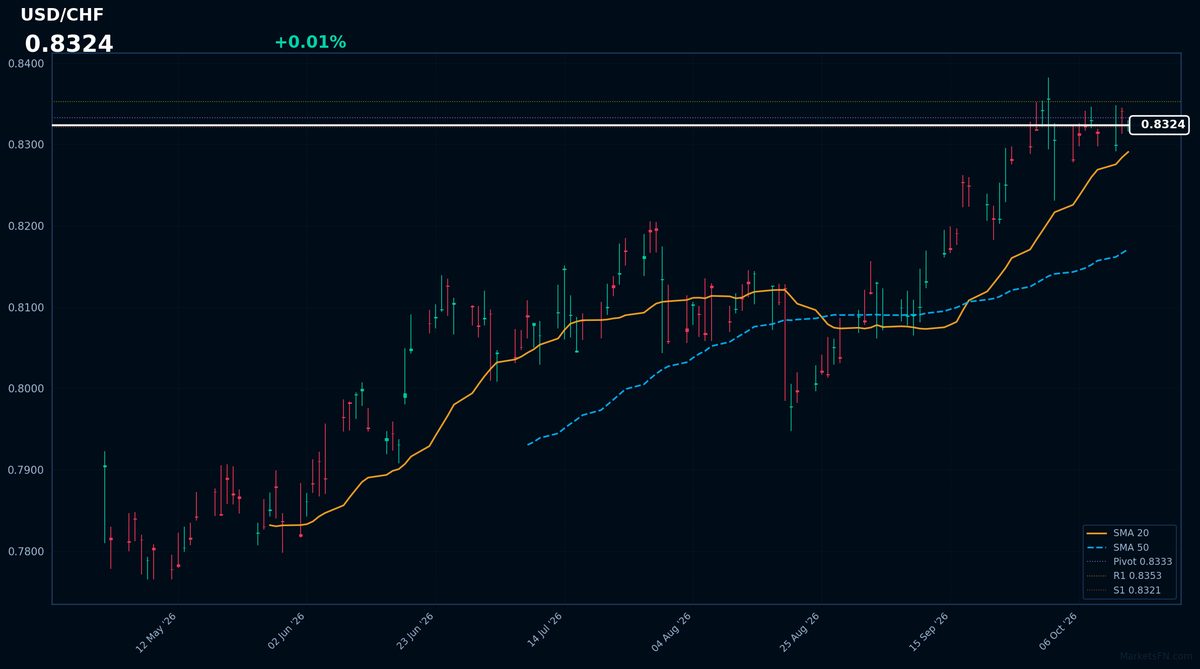
USD/CHF is in an uptrend, currently at 0.83291. Key Fibonacci support levels are 0.80943 (38.2%), 0.80055 (50.0%), and 0.79166 (61.8%). The pair remains bullish, with the 38.2% level as a potential pullback zone. A hold above 0.80943 could sustain the uptrend, while a break below 0.80055 may weaken momentum.
AUD/USD — Daily Fibonacci
Uptrend ↑ · Current: 0.70102
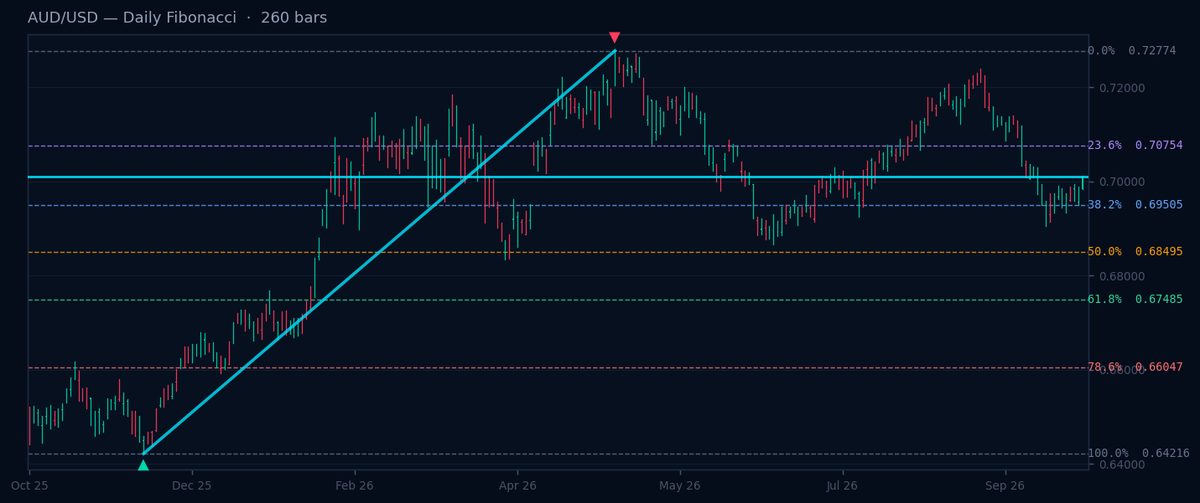
AUD/USD is in an uptrend, trading at 0.70102. Key Fibonacci support levels are 0.69505 (38.2%), 0.68495 (50.0%), and 0.67485 (61.8%). The pair shows bullish bias, with the 38.2% level as a critical floor. A hold above 0.69505 could extend gains, while a break below 0.68495 may trigger a deeper correction.
USD/CAD — Daily Fibonacci
Uptrend ↑ · Current: 1.42108
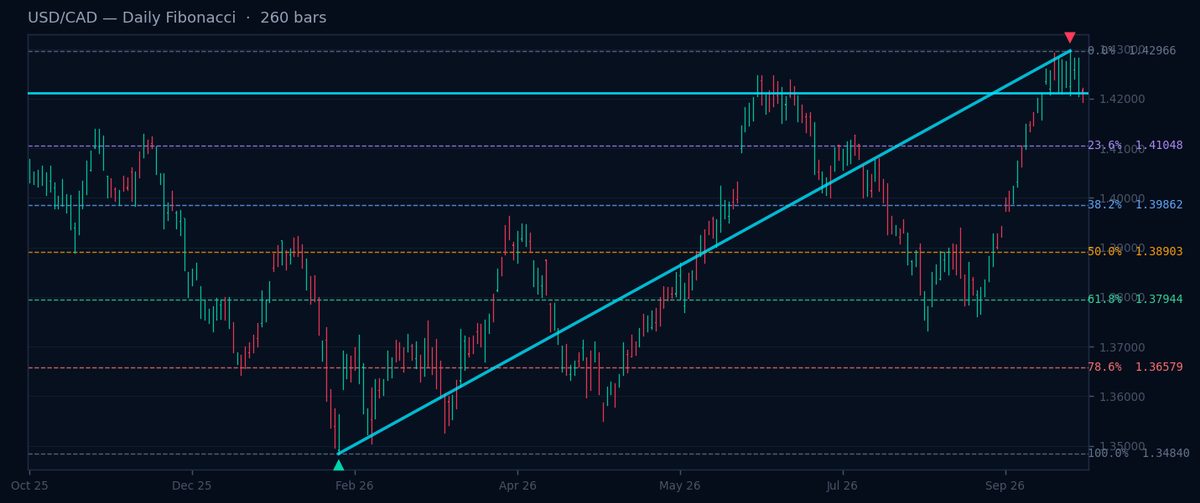
USD/CAD is in an uptrend, currently at 1.42108. Key Fibonacci support levels are 1.39862 (38.2%), 1.38903 (50.0%), and 1.37944 (61.8%). The pair remains bullish, with the 38.2% level as a potential pullback zone. A hold above 1.39862 could sustain momentum, while a break below 1.38903 may signal a correction.
NZD/USD — Daily Fibonacci
Downtrend ↓ · Current: 0.56221
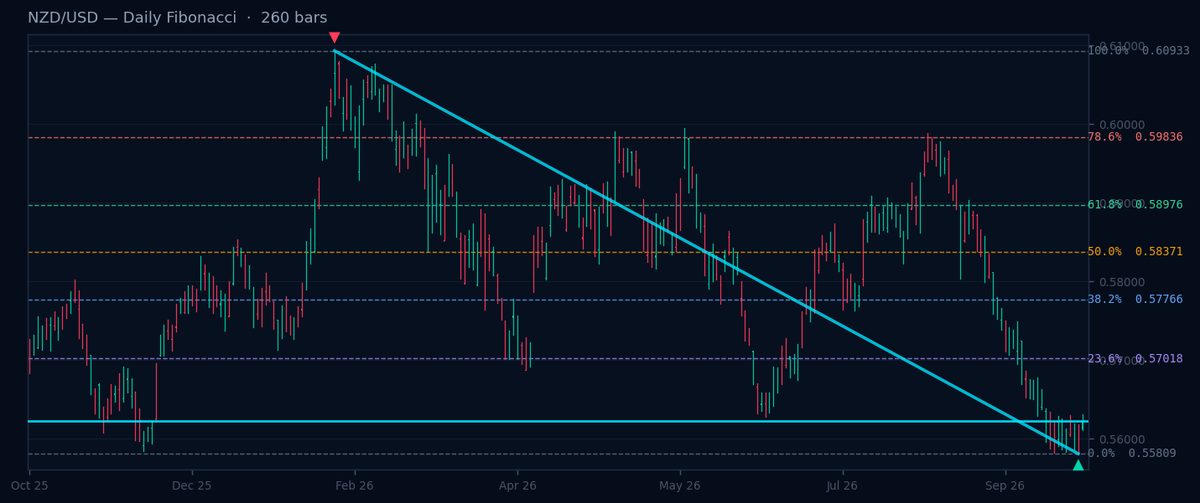
NZD/USD is in a downtrend, trading at 0.56221. Key Fibonacci resistance levels are 0.58976 (61.8%), 0.58371 (50.0%), and 0.57766 (38.2%). The pair faces selling pressure, with the 61.8% level as a strong barrier. A break above 0.57766 could signal a short-term bounce, but the overall trend remains bearish. Watch for rejection near these levels.
Dashboard
Insider Trading
Track real-time SEC Form 4 filings — see what company insiders are buying and selling.
Dashboard
Hedge Funds 13F Tracker
Monitor quarterly 13F filings — discover what the world's top hedge funds are holding.
Disclaimer
This article is for educational and informational purposes only and does not constitute financial advice or a recommendation to buy or sell any financial instrument. Fibonacci retracement levels are technical analysis tools used to identify potential support and resistance zones. All trading involves risk, including the possible loss of principal. Past performance is no guarantee of future results. You are solely responsible for your own investment decisions.