EUR/USD: Down 0.16% to 1.1219 — Descending Channel
MarketsFN Team
EUR/USD: Down 0.16% to 1.1219 — Descending Channel
Published: October 21, 2026 · MarketsFN Team · US Session
| Pair | Rate | Change | RSI(14) | SMA-20 | SMA-50 | 52W High | 52W Low | Pivot | R1 | S1 |
|---|---|---|---|---|---|---|---|---|---|---|
| EUR/USD | 1.1219 | -0.16% | 47.5 | 1.1250 | 1.1449 | 1.2041 | 1.1154 | 1.1234 | 1.1263 | 1.1207 |
📊 Support & Resistance Levels
Dynamic Trendlines
| Level | Type | Direction | Distance |
|---|---|---|---|
| 1.1078 | 20d Support | ↘ descending | -1.25% / 140.3 pips |
| 1.1251 | 20d Resistance | ↘ descending | +0.29% / 32.8 pips |
| 1.1049 | 50d Support | ↘ descending | -1.51% / 169.3 pips |
| 1.1295 | 50d Resistance | ↘ descending | +0.69% / 76.9 pips |
Static Levels
| Level | Type | Touches | Distance |
|---|---|---|---|
| 1.1668 | Resistance | 2× | +4.00% / 449.1 pips |
| 1.1654 | Resistance | 2× | +3.89% / 436.0 pips |
| 1.1640 | Resistance | 2× | +3.76% / 421.5 pips |
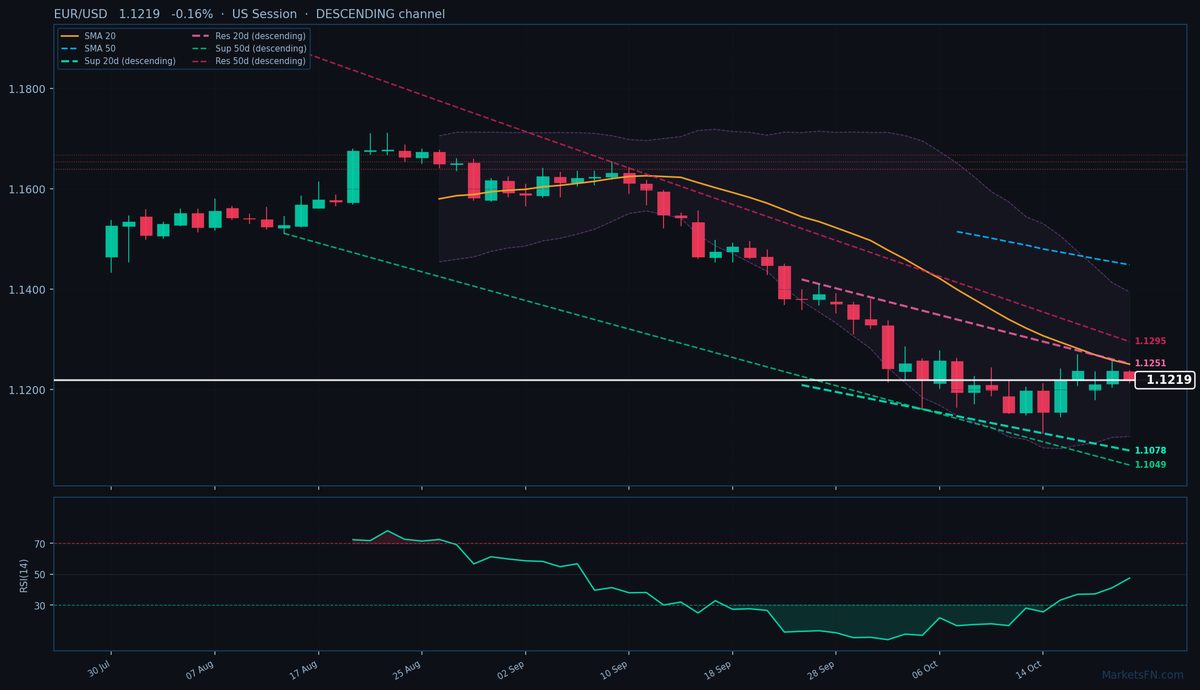
EUR/USD is trading at 1.1219 (-0.16%), testing the lower bounds of a well-defined descending channel as bearish momentum persists. The pair remains firmly below both the 20-day SMA (1.1250, 31.1 pips above) and 50-day SMA (1.1449, 230 pips above), confirming the broader downtrend. Price action today has been contained within a tight 23-pip range (1.1214-1.1237), failing to reclaim yesterday's close at 1.1237 as sellers dominate the US session.
The 20-day dynamic resistance trendline sits just 32.8 pips above at 1.1251, while dynamic support lies 140.3 pips below at 1.1078 — both descending at an average slope. The 50-day channel shows similar bearish structure, with resistance at 1.1295 (76.9 pips above) and support at 1.1049 (169.3 pips below). Nearest static levels are pivot S1 at 1.1207 (12.2 pips below) and R1 at 1.1263 (44.4 pips above), though more significant resistance clusters loom above 1.1640 (421.5 pips away).
RSI at 47.5 shows neutral momentum with no immediate oversold or overbought signals, while the 14-day ATR of 68 pips suggests subdued volatility. The failure to hold above the 20-day dynamic resistance (1.1251) and pivot point (1.1234) today reinforces bearish control. A break below S1 (1.1207) could accelerate losses toward the 52-week low at 1.1154 (65.5 pips below). Confirmation of continued downside would come with a daily close beneath 1.1200, while bulls need to reclaim 1.1263 (R1) to challenge the descending 20-day resistance.
Disclaimer
The content on MarketsFN.com is provided for educational and informational purposes only and does not constitute financial advice. All investments involve risk and past performance does not guarantee future results.