EUR/USD: Down 0.06% to 1.1618 — Bullish — Above Key MAs
MarketsFN Team
EUR/USD: Down 0.06% to 1.1618 — Bullish — Above Key MAs
Published: September 04, 2026 · MarketsFN Team · US Session
| Pair | Rate | Change | RSI(14) | SMA-20 | SMA-50 | 52W High | 52W Low | Pivot | R1 | S1 |
|---|---|---|---|---|---|---|---|---|---|---|
| EUR/USD | 1.1618 | -0.06% | 55.7 | 1.1607 | 1.1508 | 1.2041 | 1.1358 | 1.1616 | 1.1650 | 1.1592 |
📊 Support & Resistance Levels
Dynamic Trendlines
| Level | Type | Direction | Distance |
|---|---|---|---|
| 1.1574 | 20d Support | ↗ ascending | -0.38% / 44.1 pips |
| 1.1717 | 20d Resistance | → flat | +0.86% / 99.7 pips |
| 1.1567 | 50d Support | ↗ ascending | -0.44% / 50.9 pips |
| 1.1786 | 50d Resistance | ↗ ascending | +1.45% / 168.4 pips |
Static Levels
| Level | Type | Touches | Distance |
|---|---|---|---|
| 1.1779 | Resistance | 2× | +1.39% / 161.1 pips |
| 1.1729 | Resistance | 2× | +0.96% / 110.9 pips |
| 1.1668 | Resistance | 2× | +0.43% / 49.8 pips |
| 1.1616 | Support | 2× | -0.01% / 1.7 pips |
| 1.1575 | Support | 3× | -0.37% / 43.1 pips |
| 1.1505 | Support | 2× | -0.97% / 112.3 pips |
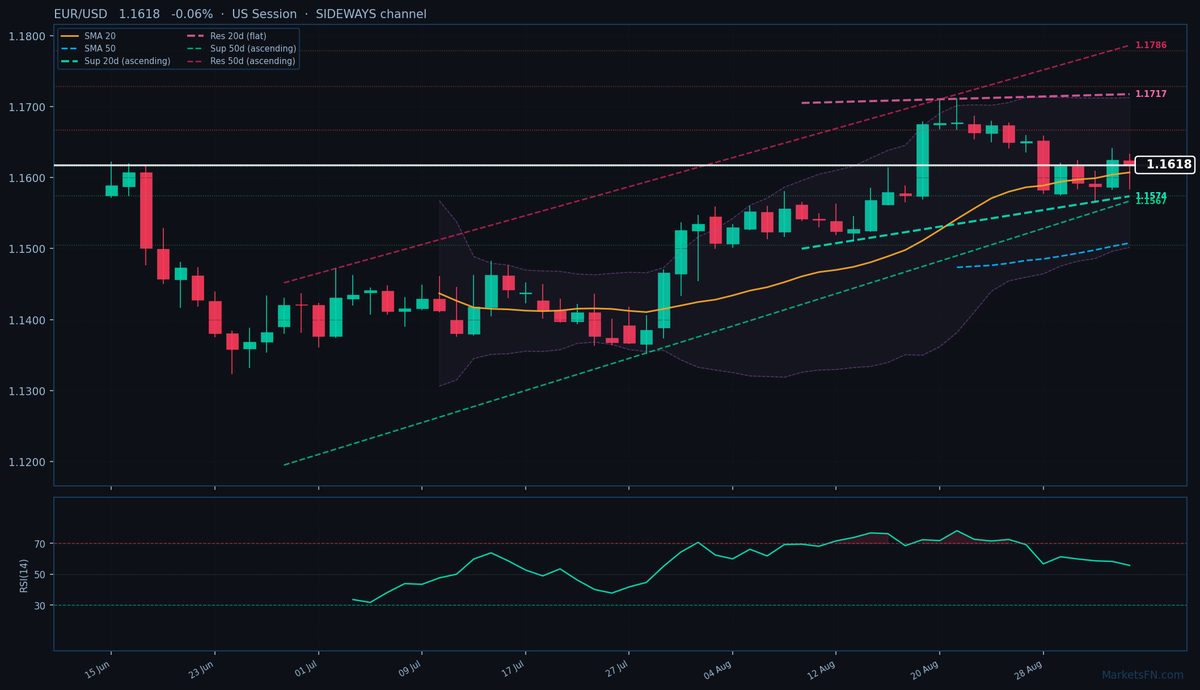
EUR/USD is trading at 1.1618 (-0.06%), clinging to minor support at the S1 pivot (1.1616, just 1.7 pips below) after failing to hold above yesterday’s close. The pair remains in a technical uptrend, trading above both the 20-day (1.1607) and 50-day (1.1508) SMAs, but momentum is waning as the 20-day dynamic channel flattens into a sideways pattern. The nearest dynamic resistance sits at 1.1717 (99.7 pips above), while the ascending 50-day resistance looms higher at 1.1786 (+1.45%, 168.4 pips away). Downside risks are limited by the 20-day dynamic support at 1.1574 (-0.38%, 44.1 pips below), reinforced by static support at S2 (1.1575, 43.1 pips away).
RSI at 55.7 shows neutral momentum, lacking conviction for a breakout in either direction. The tight daily range (1.1584–1.1633) and muted ATR of 0.0046 reflect market indecision ahead of key US data. Immediate resistance at R1 (1.1668, 49.8 pips above) needs to break to confirm bullish continuation, while a close below S2 (1.1575) would signal a deeper pullback toward the 50-day dynamic support at 1.1567.
Short-term, the pair is trapped between static levels, with the 20-day SMA (1.1607) acting as a pivot. Watch for a decisive break above 1.1650 (R1 pivot) or below 1.1592 (S1) to gauge direction. The next catalyst is Friday’s US payrolls data — a strong print could reignite dollar strength and test the 20-day dynamic support. Until then, expect choppy consolidation within the 1.1575–1.1668 range.
Disclaimer
The content on MarketsFN.com is provided for educational and informational purposes only and does not constitute financial advice. All investments involve risk and past performance does not guarantee future results.