European Session Crude Oil Report — 22 Oct 2026
QuoteReporter
Crude oil markets hold steady in European trading as Brent tests the $103 level while WTI struggles below $91, with the Brent-WTI spread widening to $12.16 as European refiners face tighter Atlantic Basin supply. Brent gains 0.75% on the session, buoyed by ongoing Middle East tensions, while WTI drifts 0.27% lower ahead of the NYMEX open, its RSI plunging to oversold territory at 22.5. The Asian session saw both benchmarks trapped in narrow ranges—WTI between $90.50-$91.20 and Brent $102.70-$103.30—as traders await fresh catalysts.
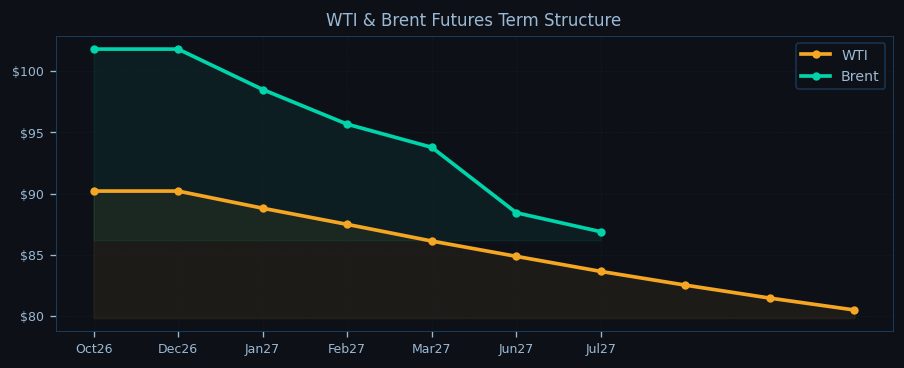
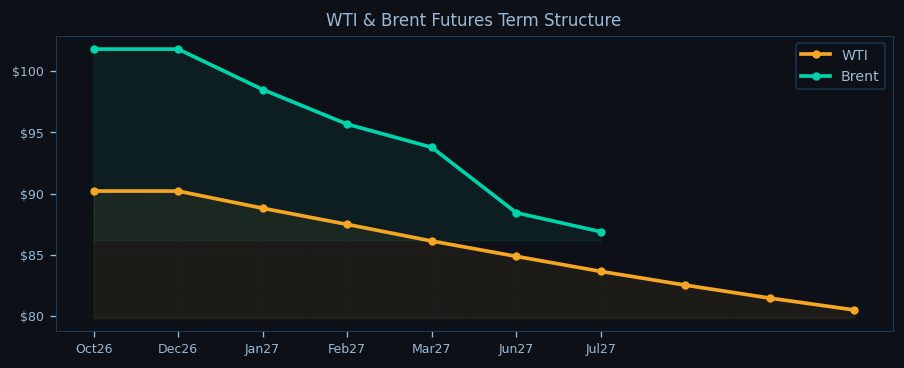
Technicals paint a diverging picture: Brent hovers just below its EMA9 at $103.07, showing relative strength with RSI at 38.9, while WTI trades $1.48 below its EMA9 at $92.34 with bearish momentum accelerating. The front-month WTI contract tests pivotal support at the daily pivot point of $89.46, with the next downside target at S1 ($72.17) looking distant barring a macro shock. Brent’s structure appears more resilient, holding above its PP ($96.17) with immediate resistance at R1 ($117.04). The steeper backwardation in Brent (-14.6% Oct26-Jul27 vs WTI’s -10.8%) reflects ongoing Atlantic Basin tightness as European refiners compete for dwindling medium sour barrels.

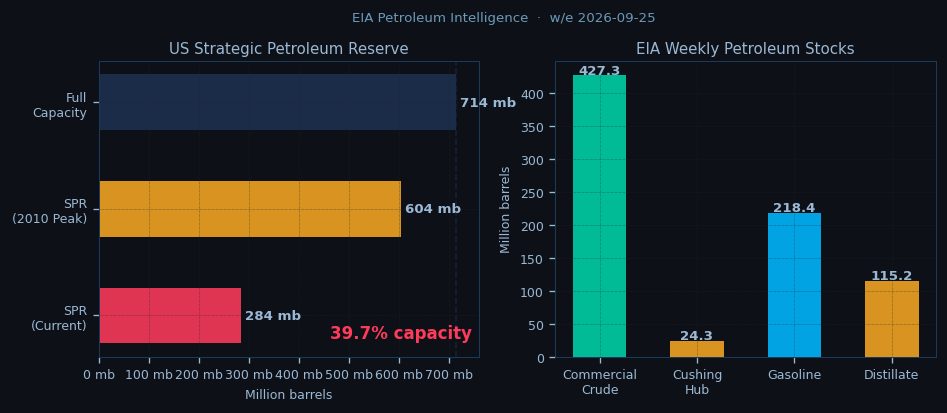
Geopolitical risk premiums linger with Hormuz tensions elevated after fresh IRGC tanker intercepts—20 million bbl/d of flows remain at risk. The Bab-el-Mandeb chokepoint stays on watch as Houthi attacks force VLCCs to reroute via the Cape of Good Hope, adding seven days to voyages. OPEC+ discipline shows cracks as Iraq and Russia exceed quotas, though Saudi compliance remains ironclad. US crude inventories hover near seasonal highs at 427.3 million barrels, but the 0.6 million bbl/d OPEC+ deficit keeps structural supply concerns alive.
The term structure signals diverging regional dynamics: Brent’s steep backwardation contrasts with WTI’s shallower curve, reflecting stronger European refinery demand and Middle East disruptions. The Brent-WTI spread at $12.16 pressures European refiners already grappling with reduced Urals availability. Cushing stocks at 24.3 million barrels suggest adequate WTI deliverability, but backwardation indicates expectations for further draws.
As the session unfolds, focus shifts to the NYMEX open with WTI needing to reclaim $92.34 (EMA9) to stabilize its technical breakdown, while Brent eyes a test of $104 if Middle East risks escalate. The spread remains the key intraday driver—a move above $13 could trigger European refinery run cuts. Downside for WTI appears limited near $89.46 pivot support, but any break risks a flush toward $85. For Brent, the $101.80-$103.30 Asian range holds unless geopolitical headlines disrupt. With US refinery runs at 92.5% and OPEC+ cuts locked through December, the market balances on a knife-edge between ample inventories and chokepoint fragility.

Disclaimer
The content on MarketsFN.com is provided for educational and informational purposes only. It does not constitute financial advice, investment recommendations, or trading guidance. All investments involve risks, and past performance does not guarantee future results. You are solely responsible for your investment decisions and should conduct independent research and consult a qualified financial advisor before acting. MarketsFN.com and its authors are not liable for any losses or damages arising from your use of this information.
Related Articles
- US Session Crude Oil Report — 21 Oct 2026 — WTI crude hovers near $90.86 in early New York trade, testing the lower bounds of its weekly range as bearish momentum…
- Timor Leste Earthquake Pressures Nickel Prices — Earthquake in Timor Leste: Nickel Supply Chain Concerns Today, a magnitude 5.1 earthquake struck 164 km northeast of…
- European Session Crude Oil Report — 21 Oct 2026 — Crude oil markets trade mixed in the European session as Brent holds above $103 while WTI struggles below $91, with the…
- US Session Crude Oil Report — 20 Oct 2026 — WTI crude is trading at $90.86 in early US session action, struggling to hold above the psychologically critical $90…
- European Session Crude Oil Report — 20 Oct 2026 — Crude oil markets remain under pressure in early European trading as WTI hovers near $90.86, down 0.27% on the session,…