Dogecoin Holds Steady at $0.0893 as RSI Signals Neutral Momentum
QuoteReporter
•2 min read
Dogecoin Holds Steady at $0.0893 as RSI Signals Neutral Momentum
Dogecoin (DOGE/USD) | September 08, 2026 $0.0893 -1.41%
🔍 Technical Analysis
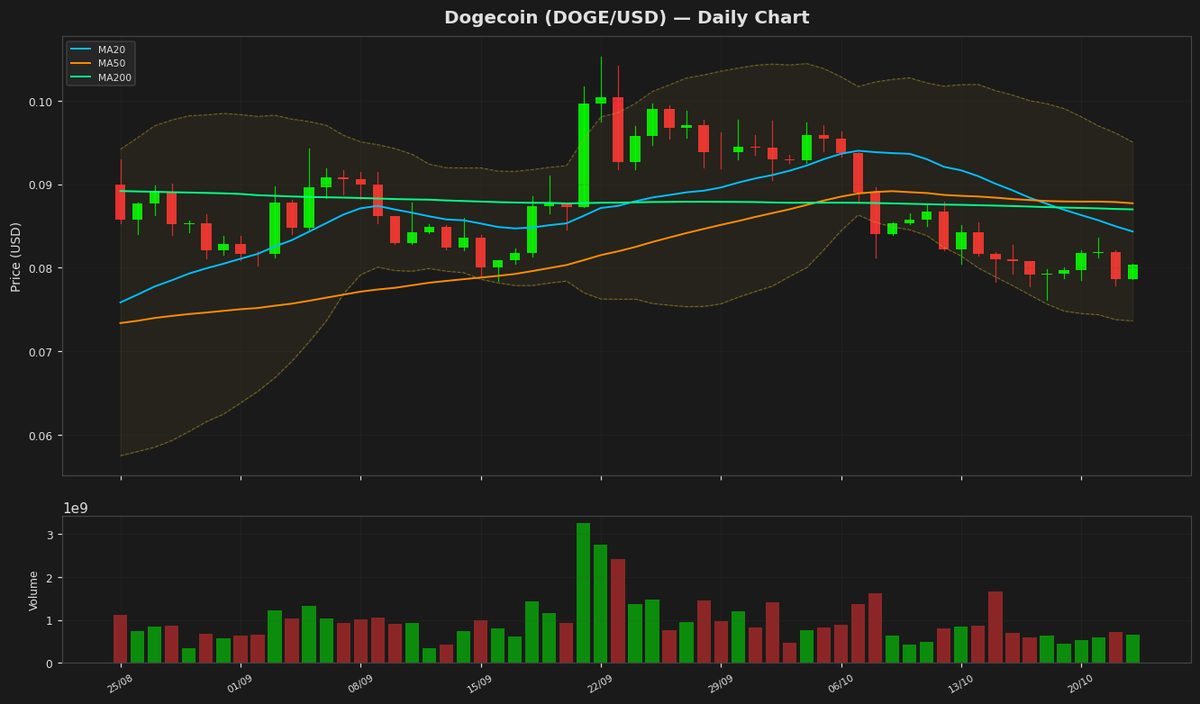
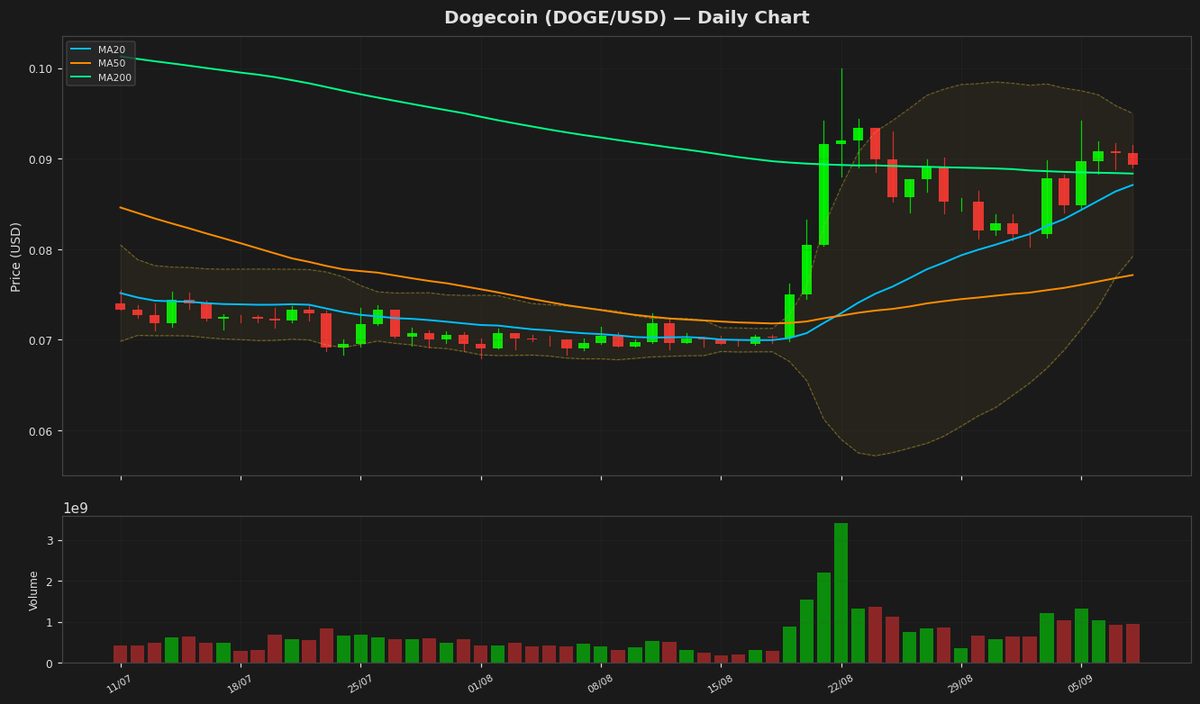
Dogecoin (DOGE) is currently trading at $0.089350, showing a slight daily decline of 1.41%. The price remains above the 20-day moving average (MA20) at $0.087085, indicating short-term bullish momentum, while the 50-day moving average (MA50) at $0.077135 reinforces a medium-term uptrend. The 200-day moving average (MA200) at $0.088341 is acting as a key dynamic support level. Bollinger Bands show the upper band at $0.094985 and the lower band at $0.079184, suggesting the price is trading near the middle band, reflecting neutral volatility. The Relative Strength Index (RSI) at 56.25 indicates a balanced market, neither overbought nor oversold. The MACD histogram shows a slight bullish crossover, with the MACD line (0.003313) above the signal line (0.003209), hinting at potential upward momentum. Key support levels are seen at $0.079184 (Bollinger Lower Band) and the psychological $0.075 level, while resistance lies at $0.094985 (Bollinger Upper Band) and the yearly high of $0.156091. The Average True Range (ATR) at 0.004162 suggests moderate volatility. Given the current technical setup, DOGE may consolidate between $0.079 and $0.095 before a decisive breakout. A sustained move above $0.095 could target higher resistance, while a drop below $0.079 may test the MA50 support.
Technical Metrics
| Metric | Value |
|---|---|
| Current Price | $0.0893 |
| Daily Change | -1.41% |
| MA 20 | $0.0871 |
| % from MA20 | +2.60% |
| MA 50 | $0.0771 |
| % from MA50 | +15.84% |
| MA 200 | $0.0883 |
| % from MA200 | +1.14% |
| BB Upper | $0.0950 |
| % from BB Upper | -5.93% |
| BB Lower | $0.0792 |
| % from BB Lower | +12.84% |
| RSI (14) | 56.25 |
| MACD | 0.003313 |
| MACD Signal | 0.003209 |
| ATR (14) | 0.004162 |
| 3-Day High | $0.0919 |
| 3-Day Low | $0.0883 |
| 52-Week High | $0.1561 |
| % from 52W High | -42.76% |
| 52-Week Low | $0.0680 |
| % from 52W Low | +31.45% |
| YTD High | $0.1561 |
| % from YTD High | -42.76% |
| YTD Low | $0.0680 |
| % from YTD Low | +31.45% |
📊 Market Commentary
Dogecoin (DOGE) is currently trading at $0.0893, down 1.41% today, as the broader cryptocurrency market experiences mild consolidation. The Relative Strength Index (RSI) at 56.2 suggests a neutral to slightly bullish momentum, indicating neither overbought nor oversold conditions. Over the past 52 weeks, DOGE has fluctuated between $0.0680 and $0.1561, reflecting its characteristic volatility while remaining within a defined range.
Market sentiment for DOGE appears mixed, with traders cautiously assessing its near-term direction. The meme coin’s price action continues to be influenced by broader crypto trends, particularly Bitcoin’s performance, as well as social media activity and speculative interest. Key support levels to watch include $0.0850, a psychological and technical floor, followed by the yearly low of $0.0680. On the upside, resistance is seen near $0.0950, with a break above potentially testing higher levels toward $0.1000.
Traders are monitoring trading volume and whale activity, as large transactions often signal shifts in momentum. Additionally, developments around potential use cases or exchange listings could impact sentiment. While DOGE remains a high-risk asset driven by retail enthusiasm, its current technical setup suggests a balanced market, with neither strong buying nor selling pressure dominating. For now, sideways movement appears likely unless a catalyst emerges to disrupt the equilibrium.
Market sentiment for DOGE appears mixed, with traders cautiously assessing its near-term direction. The meme coin’s price action continues to be influenced by broader crypto trends, particularly Bitcoin’s performance, as well as social media activity and speculative interest. Key support levels to watch include $0.0850, a psychological and technical floor, followed by the yearly low of $0.0680. On the upside, resistance is seen near $0.0950, with a break above potentially testing higher levels toward $0.1000.
Traders are monitoring trading volume and whale activity, as large transactions often signal shifts in momentum. Additionally, developments around potential use cases or exchange listings could impact sentiment. While DOGE remains a high-risk asset driven by retail enthusiasm, its current technical setup suggests a balanced market, with neither strong buying nor selling pressure dominating. For now, sideways movement appears likely unless a catalyst emerges to disrupt the equilibrium.
Disclaimer
The content on MarketsFN.com is provided for educational and informational purposes only. It does not constitute financial advice or investment recommendations. All investments involve risk. Cryptocurrency markets are highly volatile. Past performance does not guarantee future results.