Crypto Market Slumps: Ripple, Dogecoin, and BNB Lead Today's Losses
QuoteReporter
•5 min read
Crypto Market Slumps: Ripple, Dogecoin, and BNB Lead Today's Losses
Crypto Market Report | September 10, 2026
📊 Crypto Market Overview
The cryptocurrency market is currently exhibiting a mixed sentiment, with some assets experiencing minor gains while others face losses. Bitcoin, the largest cryptocurrency by market capitalization, is trading at $78,139.86, down 0.15% on the day. The Relative Strength Index (RSI) for Bitcoin stands at 42.4, indicating a neutral territory, while the Moving Average Convergence Divergence (MACD) is at 2393.18, suggesting a potential trend continuation.
Other major cryptocurrencies are also showing varied performance. Ethereum is up 0.28% to $2,473.88, with an RSI of 46.5 and a MACD of 94.52. In contrast, Ripple and Dogecoin are down 0.88% and 0.86% to $1.3821 and $0.0854, respectively. Solana and BNB are also experiencing declines, with Solana down 0.34% to $101.26 and BNB down 0.46% to $719.41.
The macroeconomic context is influenced by recent news, including the US sanctioning a cryptocurrency scam marketplace and restraining $52 million in crypto assets. Additionally, SGX has opened its bitcoin and ether perpetual futures to US institutions, potentially increasing institutional participation in the market. Security concerns are also a focus, with Trezor and BitBox warning users about fake hardware wallet security alerts.
From a technical perspective, several cryptocurrencies are displaying interesting signals. Solana's RSI is at 36.8, indicating a potentially oversold condition, while BNB and Tron are above 50, suggesting a relatively stronger position. The MACD values for most assets are positive, indicating a potential trend continuation. Overall, the cryptocurrency market is currently characterized by a mix of minor price movements and significant news events, with technical indicators providing some insight into the current market dynamics.
Other major cryptocurrencies are also showing varied performance. Ethereum is up 0.28% to $2,473.88, with an RSI of 46.5 and a MACD of 94.52. In contrast, Ripple and Dogecoin are down 0.88% and 0.86% to $1.3821 and $0.0854, respectively. Solana and BNB are also experiencing declines, with Solana down 0.34% to $101.26 and BNB down 0.46% to $719.41.
The macroeconomic context is influenced by recent news, including the US sanctioning a cryptocurrency scam marketplace and restraining $52 million in crypto assets. Additionally, SGX has opened its bitcoin and ether perpetual futures to US institutions, potentially increasing institutional participation in the market. Security concerns are also a focus, with Trezor and BitBox warning users about fake hardware wallet security alerts.
From a technical perspective, several cryptocurrencies are displaying interesting signals. Solana's RSI is at 36.8, indicating a potentially oversold condition, while BNB and Tron are above 50, suggesting a relatively stronger position. The MACD values for most assets are positive, indicating a potential trend continuation. Overall, the cryptocurrency market is currently characterized by a mix of minor price movements and significant news events, with technical indicators providing some insight into the current market dynamics.
📰 Crypto News
- Here’s what happened in crypto today
- Trezor, BitBox warn users about fake hardware wallet security alerts
- US sanctions Xinbi scam marketplace, restrains $52M in crypto
- Live updates: Bitcoin ETFs post a second straight outflow while every other fund turns green
- SGX's bitcoin and ether perpetual futures are now open to U.S. institutions
- Hunter Biden’s LAPTOP blames bots after 98% crash as traders rack up six-figure losses
- Dogecoin sinks 5% to lead majors' losses, with bitcoin holding $78,000 level
- Crypto wins regardless of Clarity Act vote, Coinbase's Armstrong says
- Bitcoin Wallet Maker Trezor Says Hackers Breached Its Email Provider
- AI Is Solving Math's Best Problems Faster Than They Can Be Replaced, Terence Tao Warns
🔍 Technical Analysis
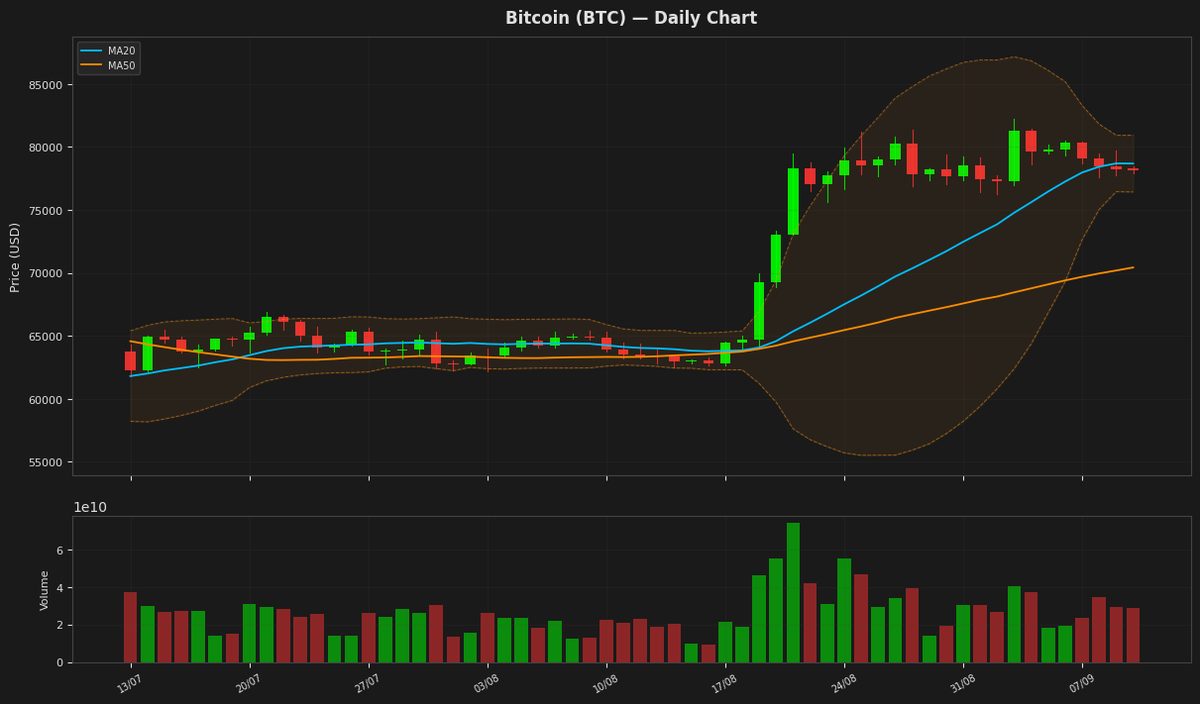
Bitcoin (BTC) — -0.15%
$78,139.86 52W: $57,747.77 — $97,860.60
Bitcoin's price is currently at $78,139.859375, showing a slight decline of 0.15% and hovering near the middle of the Bollinger Bands, with the upper band at $80,938.878031 and the lower band at $76,433.2165. The RSI is at 42.442008, indicating a neutral to slightly oversold condition, while the MACD is below its signal line, suggesting a potential bearish trend. The ATR remains relatively high at $2,145.462612, indicating significant price volatility.
Ethereum (ETH) — +0.28%
$2,473.88 52W: $1,506.51 — $3,397.90
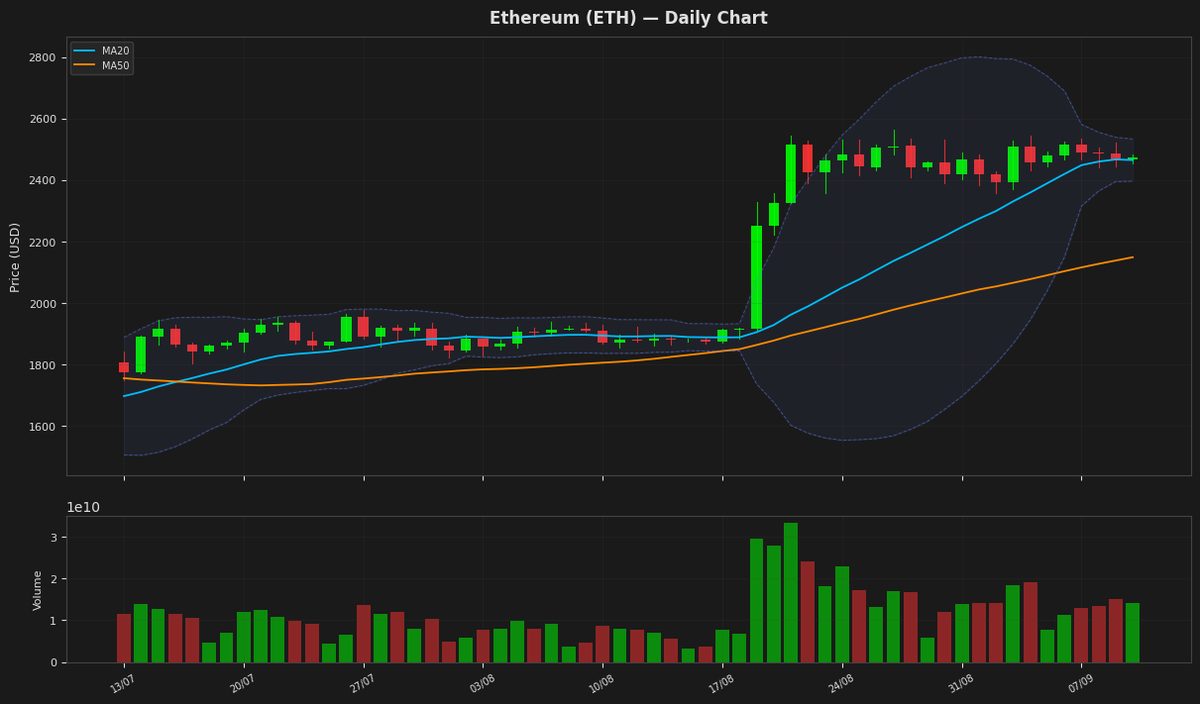
Ethereum's price is currently trading near its 20-day moving average, indicating a lack of clear direction. The Relative Strength Index is near the neutral zone, suggesting a balance between buying and selling pressures. The MACD is below its signal line, indicating a potential bearish signal, while the Bollinger Bands suggest that the price is within a relatively stable range. The Average True Range indicates moderate volatility.
Ripple (XRP) — -0.88%
$1.3821 52W: $0.988422 — $2.4103
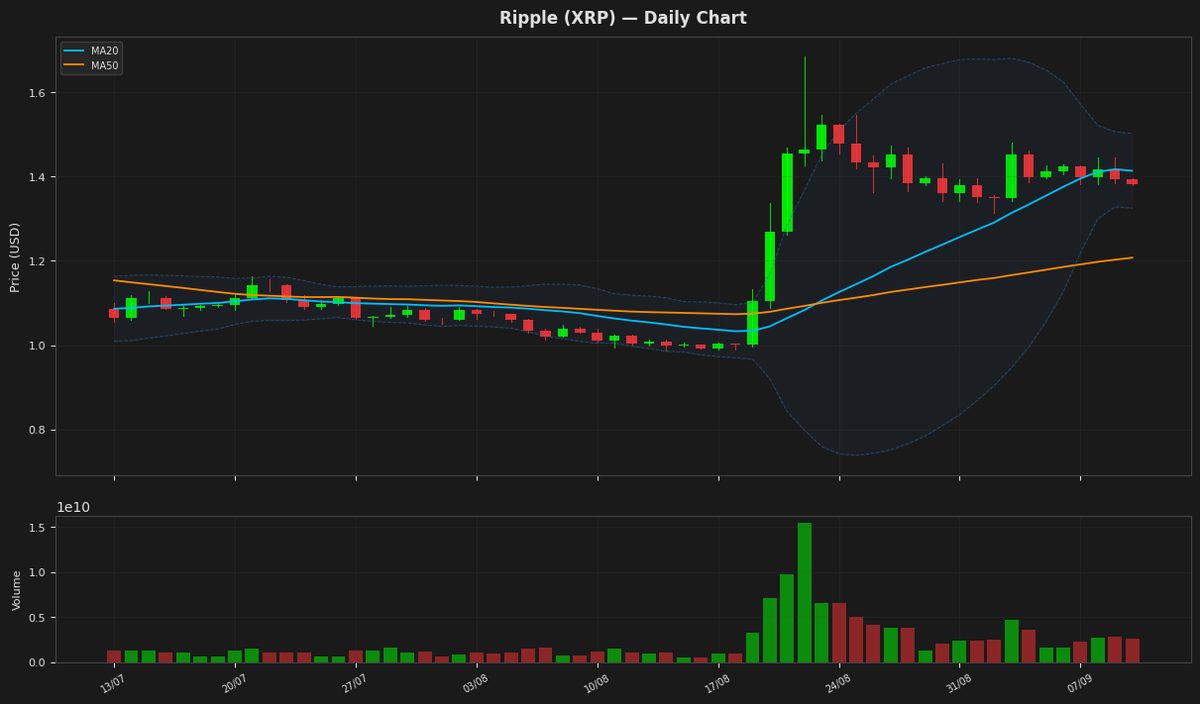
Ripple's price is currently at $1.382100, showing a slight decline, and is positioned between the 20-day moving average of 1.413484 and the upper Bollinger Band of 1.501963, indicating a potential consolidation phase. The RSI is at 41.652125, suggesting the asset is nearing oversold territory. The MACD is below its signal line, indicating a bearish signal. The Average True Range indicates moderate volatility.
Solana (SOL) — -0.34%
$101.2600 52W: $60.4147 — $148.2160
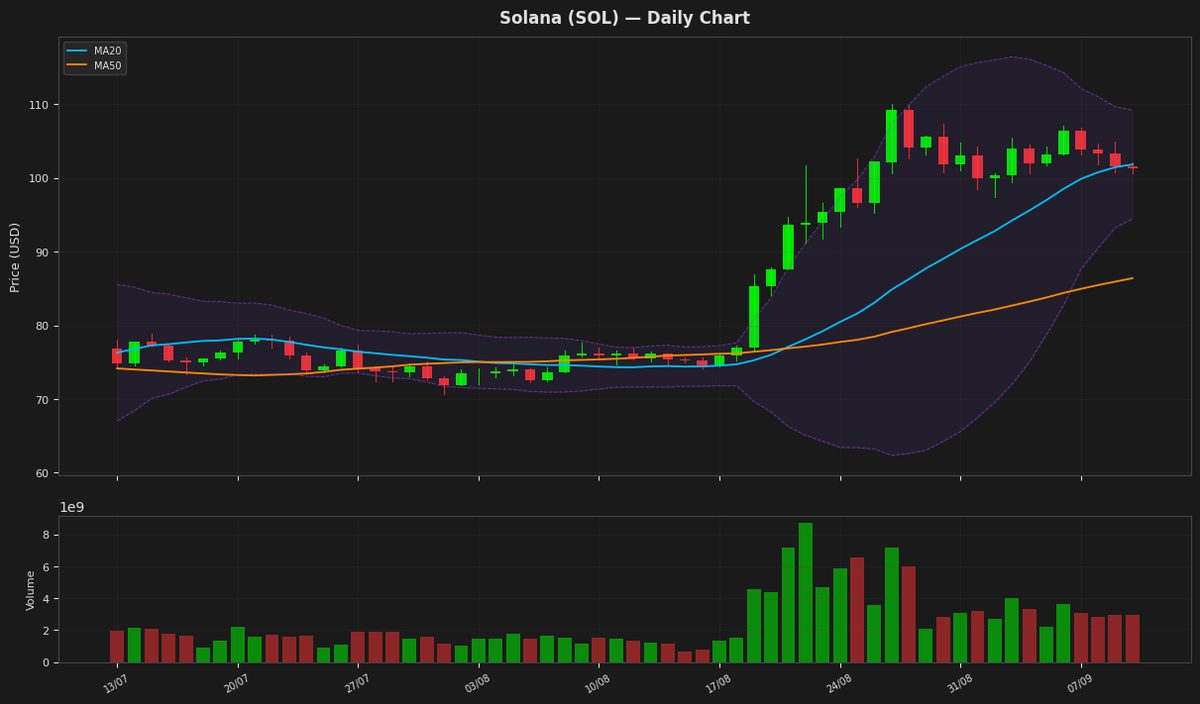
Solana's price is currently at $101.26, showing a minor decline of 0.34% and hovering around its MA20 at $101.83, indicating a potential support level. The RSI at 36.85 suggests the asset is nearing oversold territory, while the MACD below its signal line indicates a bearish trend. The Bollinger Bands suggest a support level around the lower band at $94.47.
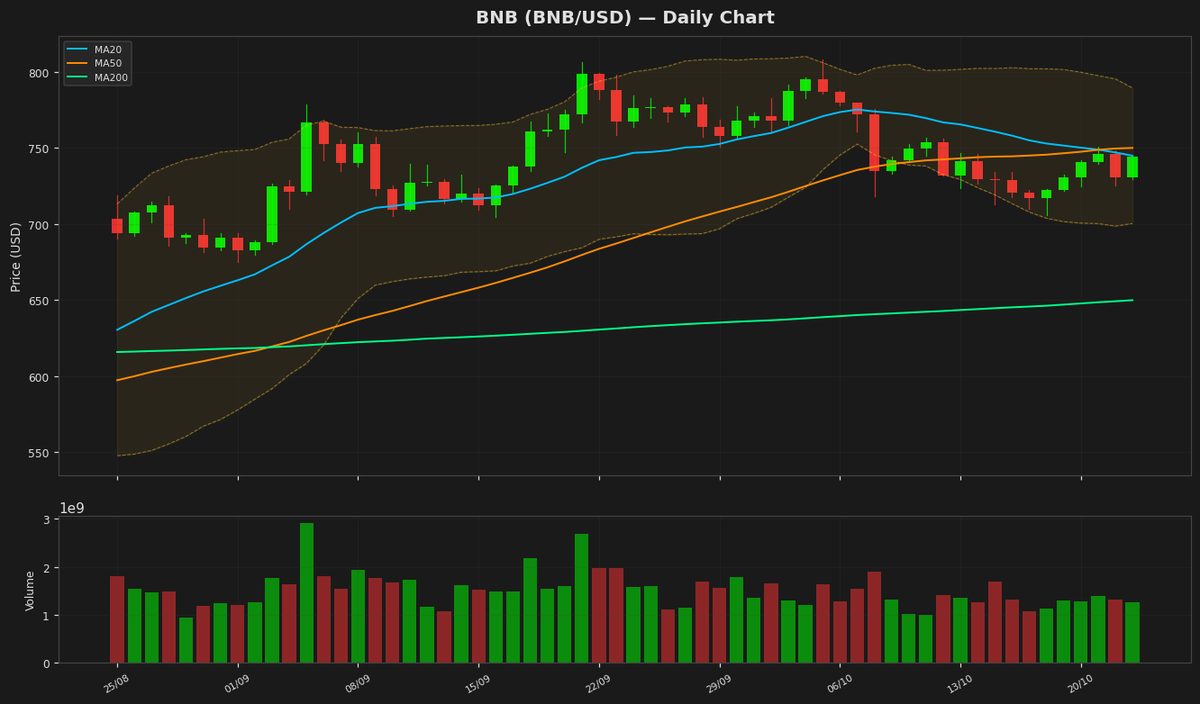
BNB (BNB) — -0.46%
$719.4100 52W: $538.5992 — $954.8583
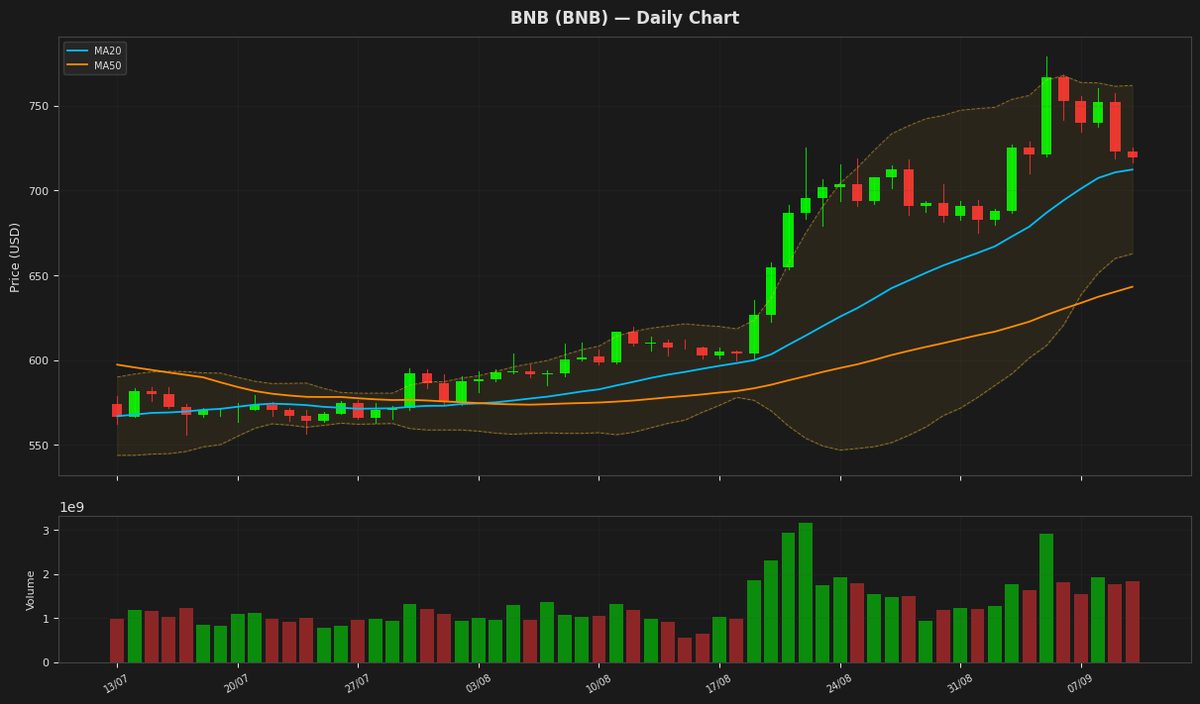
BNB is currently trading at $719.41, slightly above its 20-day moving average of $712.29, indicating a neutral to slightly bullish short-term trend. The Relative Strength Index is at 51.73, suggesting a balanced market with no extreme buying or selling pressure. The MACD is below its signal line, indicating a potential bearish crossover, while the price remains above the lower Bollinger Band, showing support.
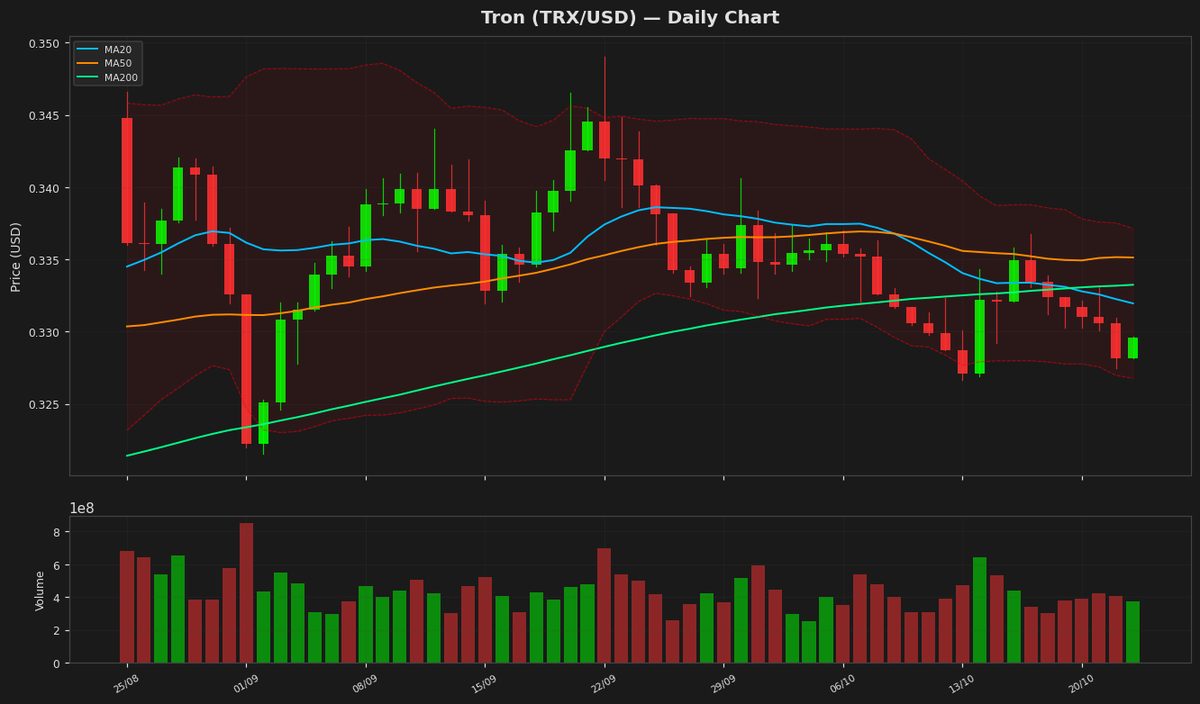
Tron (TRX) — +0.15%
$0.339370 52W: $0.268138 — $0.376332
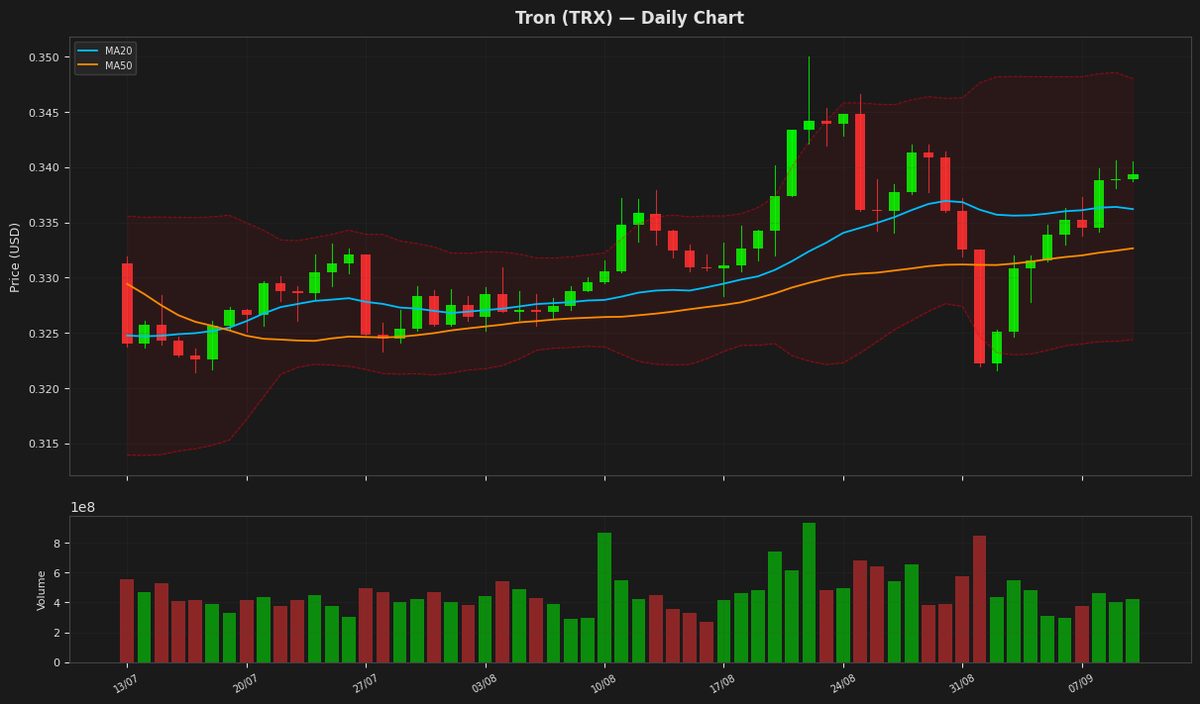
Tron's price is currently at $0.339370, showing a slight increase of 0.15% and trading near the middle of the Bollinger Bands, indicating a lack of strong directional momentum. The RSI is at 52.016152, suggesting a neutral market sentiment, while the MACD is above its signal line, indicating a potential bullish crossover. The ATR is relatively low at 0.004678, indicating low volatility.
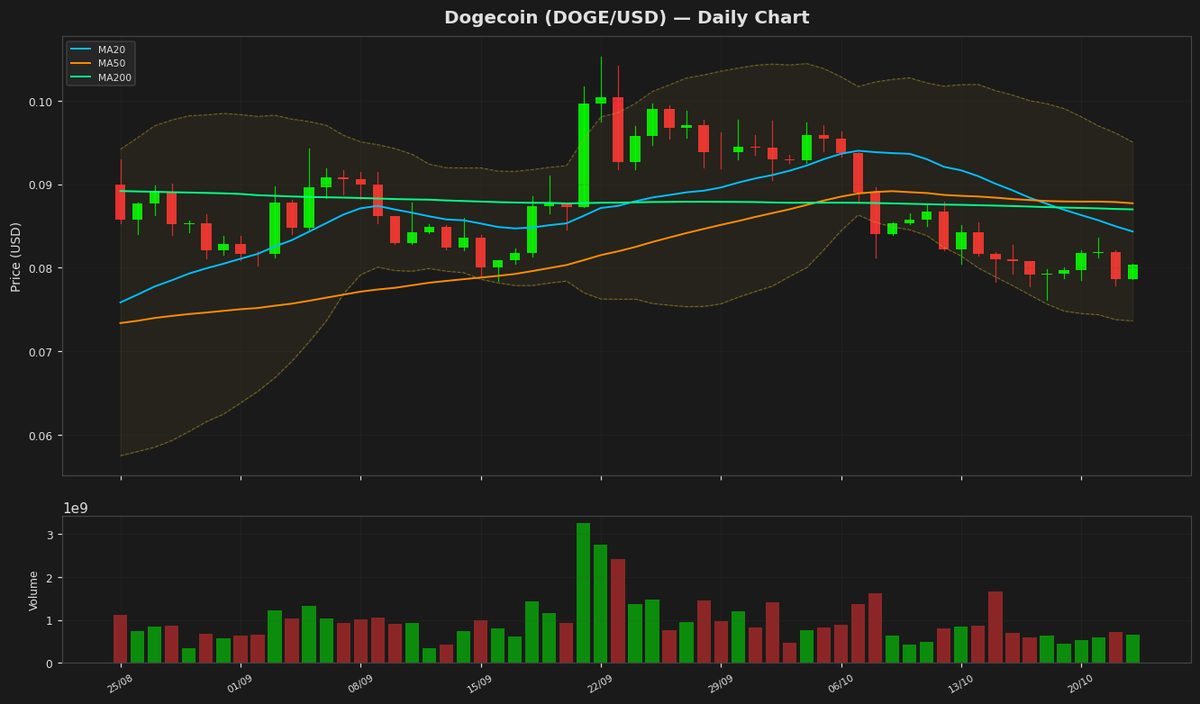
Dogecoin (DOGE) — -0.86%
$0.085420 52W: $0.067973 — $0.156091
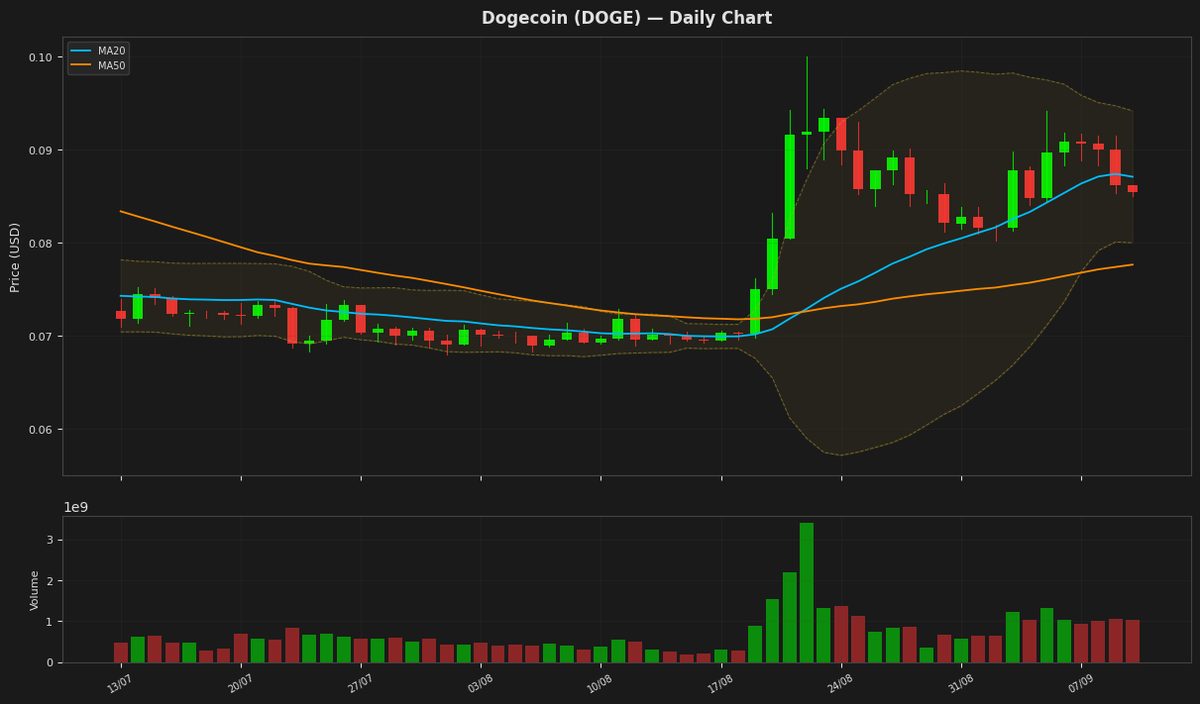
Dogecoin's price is currently at $0.085420, showing a slight decline, and is positioned between its 20-day and 50-day moving averages, indicating a potential consolidation phase. The Relative Strength Index is at 43.706677, suggesting a neutral to slightly bearish sentiment. The Bollinger Bands indicate that the price is near the lower band at $0.080009, potentially acting as a support level. The MACD is below its signal line, indicating a bearish crossover.
Disclaimer
The content on MarketsFN.com is provided for educational and informational purposes only. It does not constitute financial advice or investment recommendations. All investments involve risk. Past performance does not guarantee future results.