Crypto Market Sees Uptrend: Ripple, Solana, and Bitcoin Lead Gains
QuoteReporter
•5 min read
Crypto Market Sees Uptrend: Ripple, Solana, and Bitcoin Lead Gains
Crypto Market Report | September 09, 2026
📊 Crypto Market Overview
The cryptocurrency market is currently displaying a positive overall sentiment, with most major assets trading in the green. Bitcoin is leading the way, having risen by 1.56% to $79,658.9766, while other top players such as Ethereum, Ripple, and Solana have also seen gains, with increases of 1.44%, 1.72%, and 1.58% respectively. The Relative Strength Index (RSI) for these assets is hovering around the mid-point, indicating a balanced market without any extreme overbought or oversold conditions.
From a technical standpoint, the Moving Average Convergence Divergence (MACD) indicators for the major cryptocurrencies are largely positive, with Bitcoin's MACD standing at 2724.9287 and Ethereum's at 104.8398. BNB is an outlier, with an RSI of 62.9, indicating a relatively overbought condition compared to its peers.
Recent news has been mixed, with developments such as Iran easing currency rules potentially paving the way for increased cryptocurrency adoption as a means to bypass US sanctions. Meanwhile, regulatory scrutiny continues, with India's financial intelligence unit flagging 15 crypto platforms for anti-money laundering lapses. Institutional interest remains strong, with Jack Dorsey's Block seeking a US trust bank charter to facilitate Bitcoin and stablecoin services. The flow of funds into cryptocurrency-based exchange-traded funds (ETFs) has been varied, with XRP standing out amidst outflows from bitcoin, ether, and solana funds. Overall, the market is responding to a complex interplay of technical signals, regulatory developments, and shifting institutional attitudes towards cryptocurrencies.
From a technical standpoint, the Moving Average Convergence Divergence (MACD) indicators for the major cryptocurrencies are largely positive, with Bitcoin's MACD standing at 2724.9287 and Ethereum's at 104.8398. BNB is an outlier, with an RSI of 62.9, indicating a relatively overbought condition compared to its peers.
Recent news has been mixed, with developments such as Iran easing currency rules potentially paving the way for increased cryptocurrency adoption as a means to bypass US sanctions. Meanwhile, regulatory scrutiny continues, with India's financial intelligence unit flagging 15 crypto platforms for anti-money laundering lapses. Institutional interest remains strong, with Jack Dorsey's Block seeking a US trust bank charter to facilitate Bitcoin and stablecoin services. The flow of funds into cryptocurrency-based exchange-traded funds (ETFs) has been varied, with XRP standing out amidst outflows from bitcoin, ether, and solana funds. Overall, the market is responding to a complex interplay of technical signals, regulatory developments, and shifting institutional attitudes towards cryptocurrencies.
📰 Crypto News
- Iran eases currency rules to bypass US sanctions with crypto: Report
- Jack Dorsey’s Block seeks US trust bank charter for Bitcoin, stablecoin
- Here’s what happened in crypto today
- Gemini receives Singapore payment license for crypto services
- Cybercrime ringleader Malone Lam pleads guilty in $245M crypto theft conspiracy
- New York town weighs crypto mining and AI data center ban
- Franklin Templeton digital asset veteran takes helm at StablecoinX
- India’s financial intelligence unit flags 15 crypto platforms for AML lapses
- Live updates: XRP funds stand out among U.S. ETFs as bitcoin, ether, solana funds see outflows
- Anthropic researcher quits with a warning on AI that echoes 'The Terminator' script
- Hunter Biden defends LAPTOP ahead of Wednesday launch, calls TRUMP a ‘grift’
- Moonshot’s Kimi rattled markets. U.S. agencies now say it was trained on American models
- Bitcoin recovers toward $79,000 as Zcash records a $500 million ETF haul
- Jack Dorsey's Block Applies for Bank Charter to Custody Bitcoin
- OpenAI Says It Solved a $1M Math Problem. A Rival Mathematician Says He Did It First
🔍 Technical Analysis
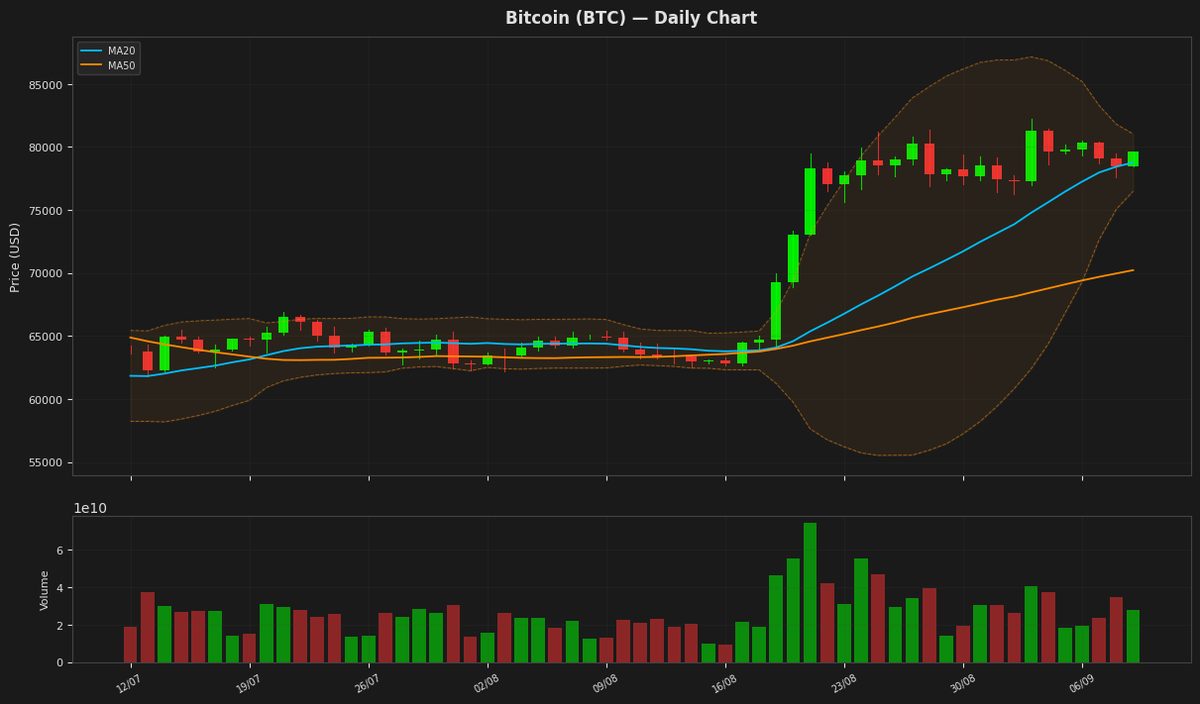
Bitcoin (BTC) — +1.56%
$79,658.98 52W: $57,747.77 — $97,860.60
Bitcoin is currently trading at $79,658.98 with a 1.56% daily gain, near its 20-day moving average of $78,765.79, indicating a stable trend. The Relative Strength Index (RSI) at 51.95 suggests a neutral market sentiment, while the MACD below its signal line indicates a potential bearish crossover. The price is also within the Bollinger Bands, with the upper band at $81,040.11 and lower band at $76,491.46.
Ethereum (ETH) — +1.44%
$2,520.61 52W: $1,506.51 — $3,397.90
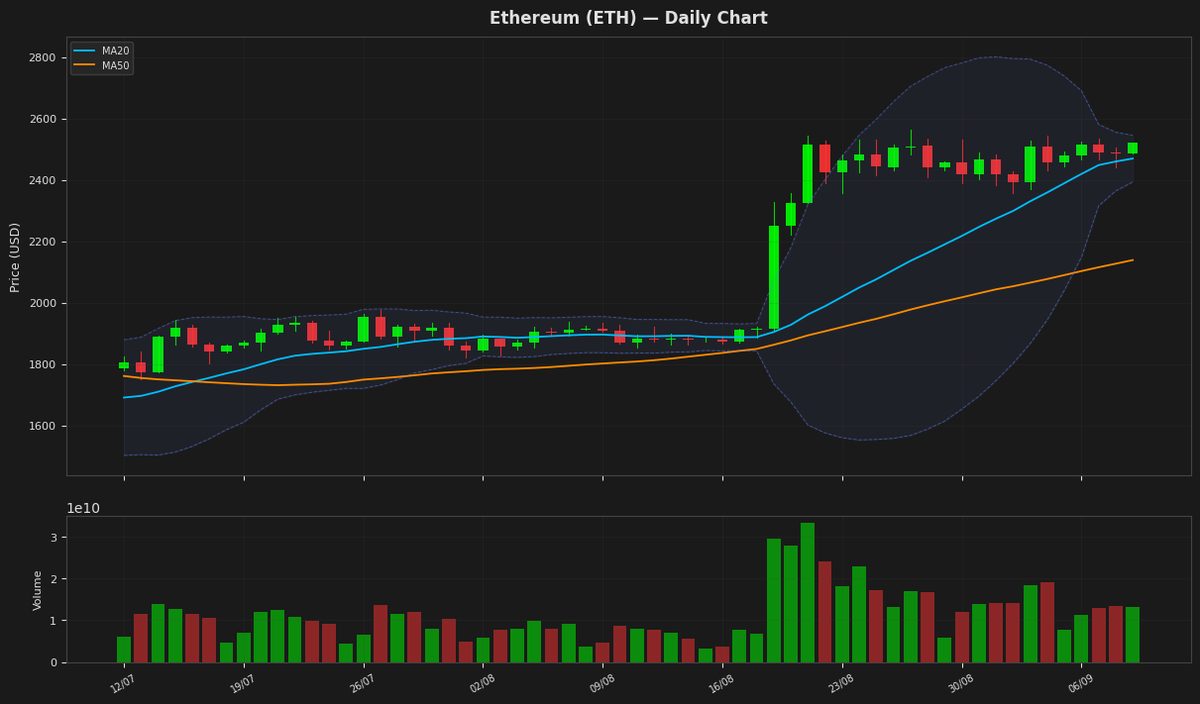
Ethereum is currently trading at $2,520.61 with a slight increase of 1.44% in a day, positioned near its 20-day moving average of $2,469.76, indicating a potential consolidation phase. The Relative Strength Index (RSI) at 51.32 suggests a neutral market sentiment. The price is also within the Bollinger Bands, with the upper band at $2,545.80 and lower band at $2,393.73, indicating moderate volatility.
Ripple (XRP) — +1.72%
$1.4406 52W: $0.988422 — $2.4103
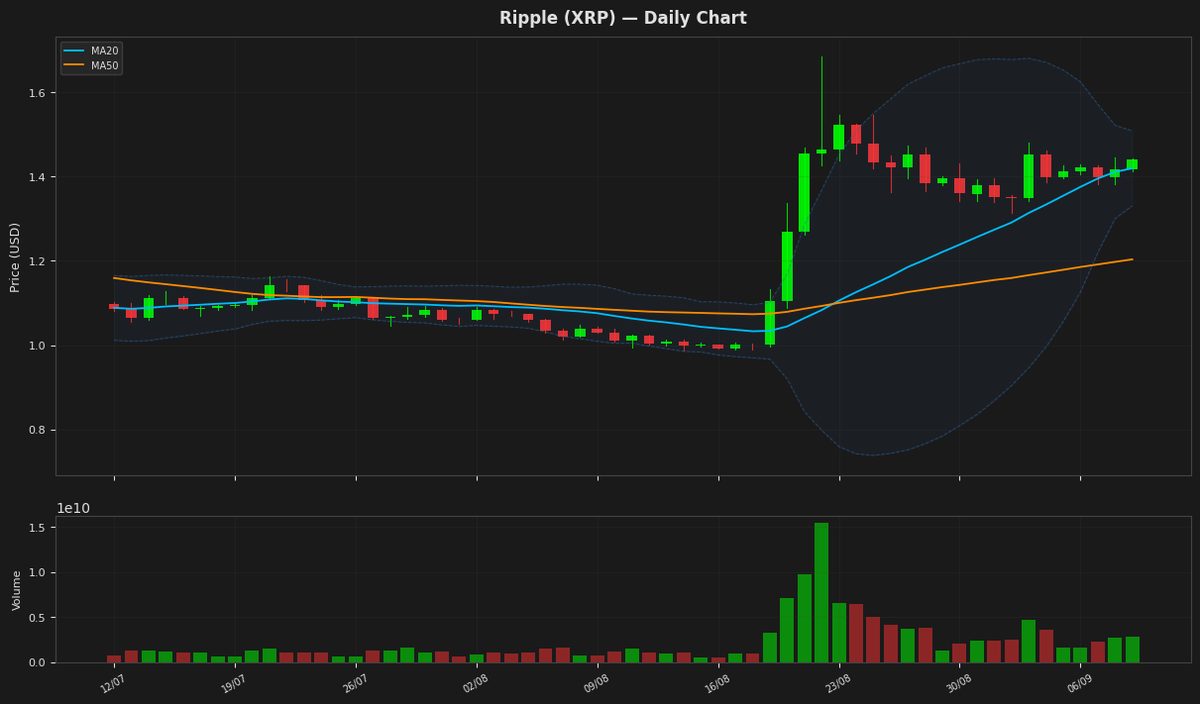
Ripple's price is currently trading above its 20-day moving average and has been on an uptrend, with the RSI indicating a neutral position. The Bollinger Bands suggest that the price is nearing the upper band, indicating potential resistance at $1.508234. The MACD is below its signal line, indicating a potential slowdown in the upward momentum. The ATR suggests moderate volatility.
Solana (SOL) — +1.58%
$104.9600 52W: $60.4147 — $148.2160
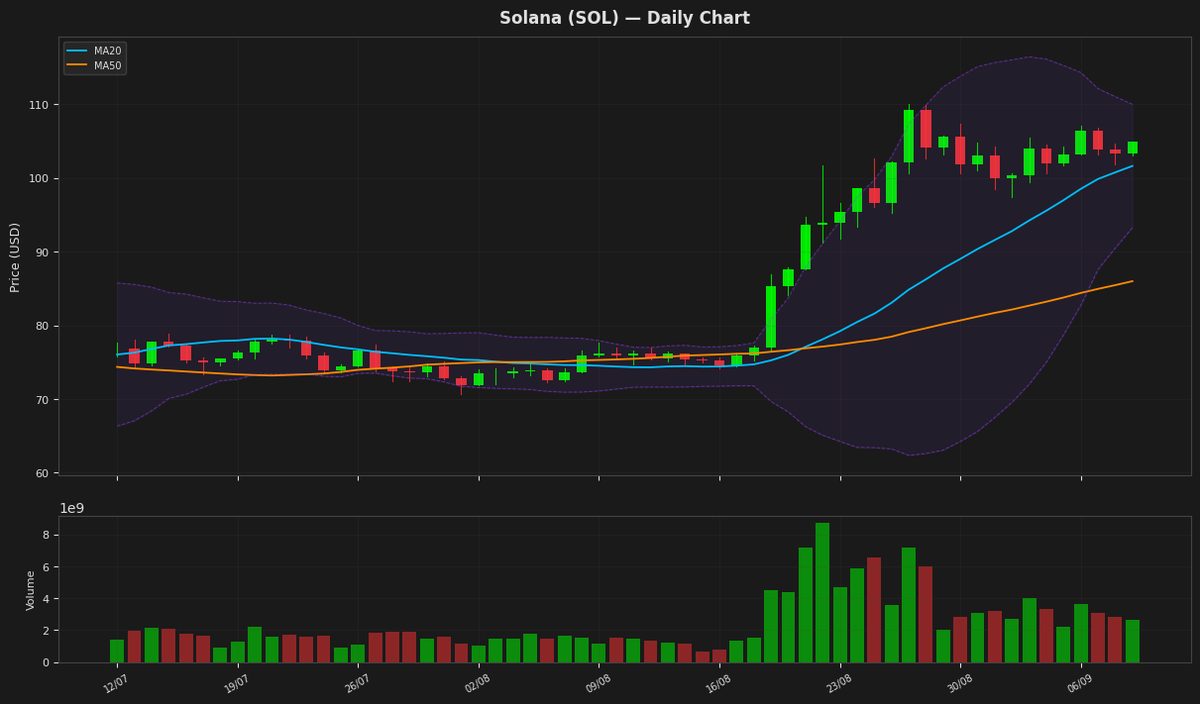
Solana's price is currently trading at $104.96, showing a 1.58% daily gain, and is positioned above its MA20 at $101.61, indicating a short-term uptrend. The RSI at 53.79 suggests a neutral momentum, while the MACD below its signal line indicates a potential slowdown in the upward movement. The price is also within the Bollinger Bands, with the upper band at $109.98 and lower band at $93.25, indicating moderate volatility.
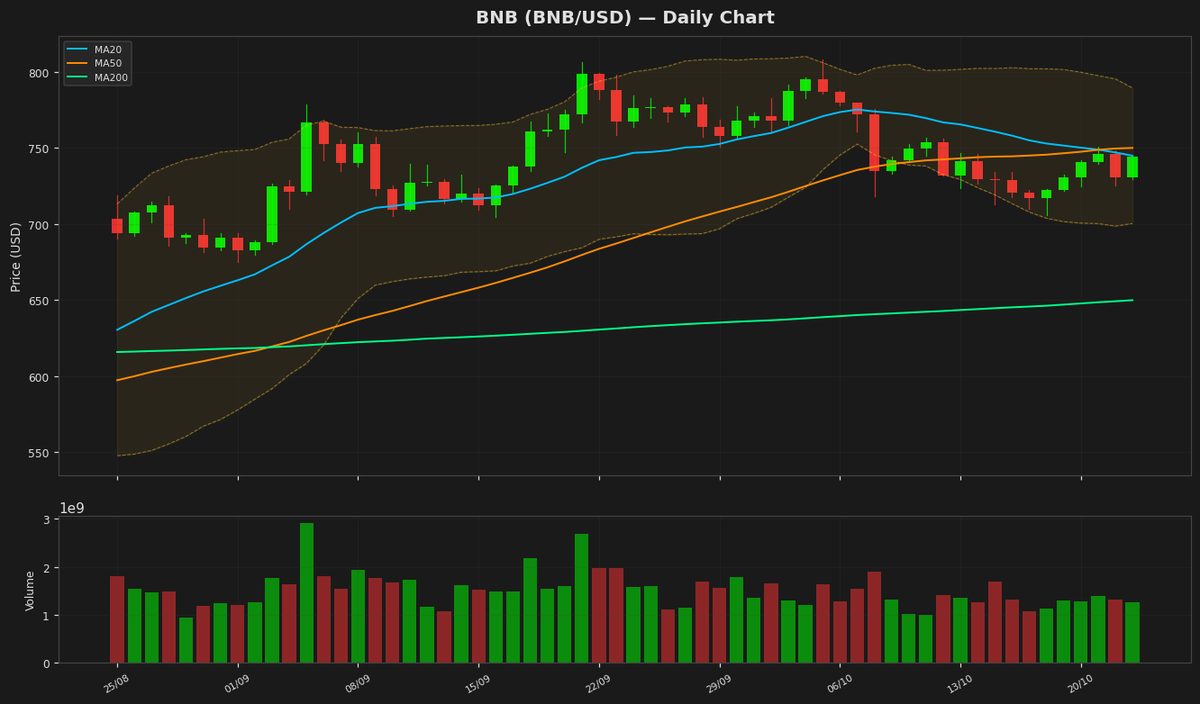
BNB (BNB) — +0.37%
$755.2200 52W: $538.5992 — $954.8583
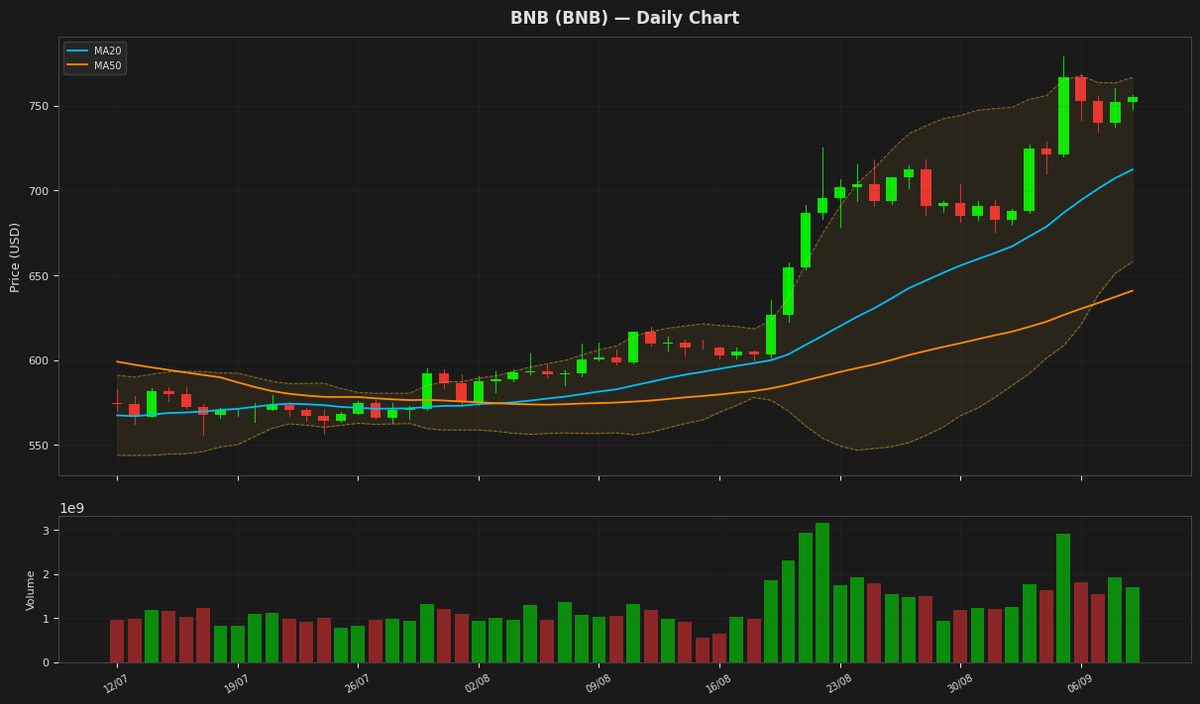
BNB is trading at $755.22, showing a slight increase of 0.37% for the day, and is positioned above both its 20-day and 50-day moving averages, indicating a positive trend. The Relative Strength Index (RSI) at 62.95 suggests the asset is not overbought, while the MACD is above its signal line, indicating a bullish signal. The price is near the upper Bollinger Band at $766.63, indicating potential resistance at this level.
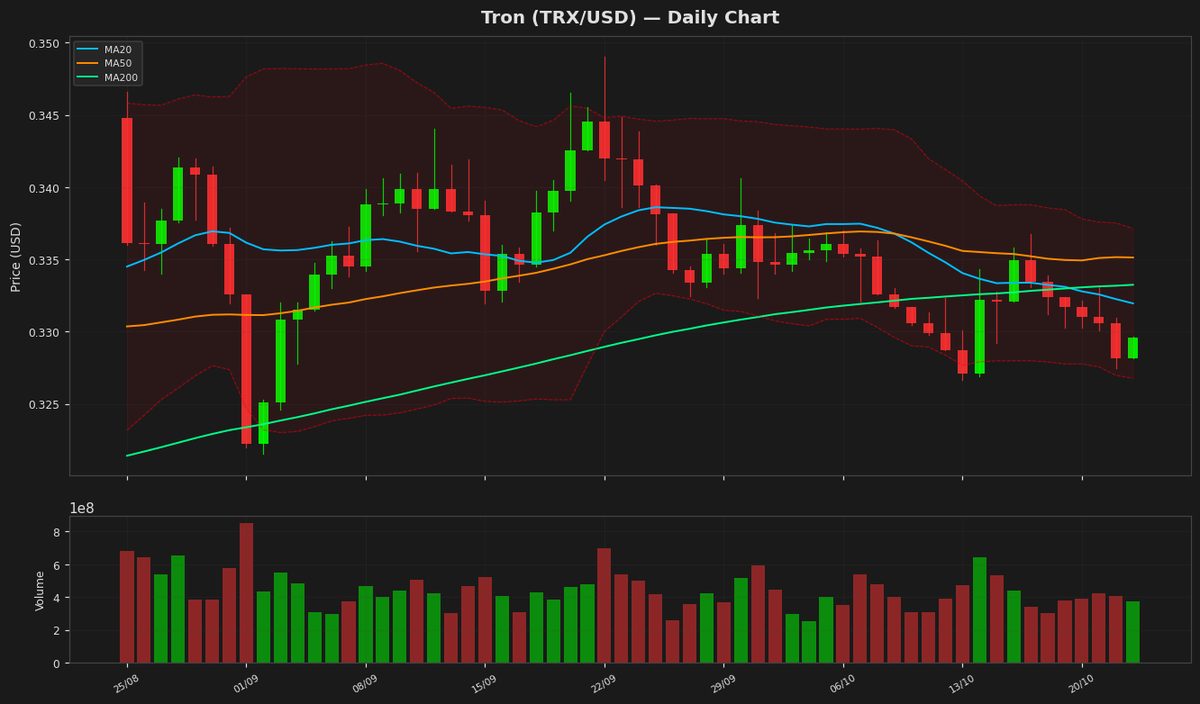
Tron (TRX) — +0.12%
$0.339214 52W: $0.268138 — $0.376332
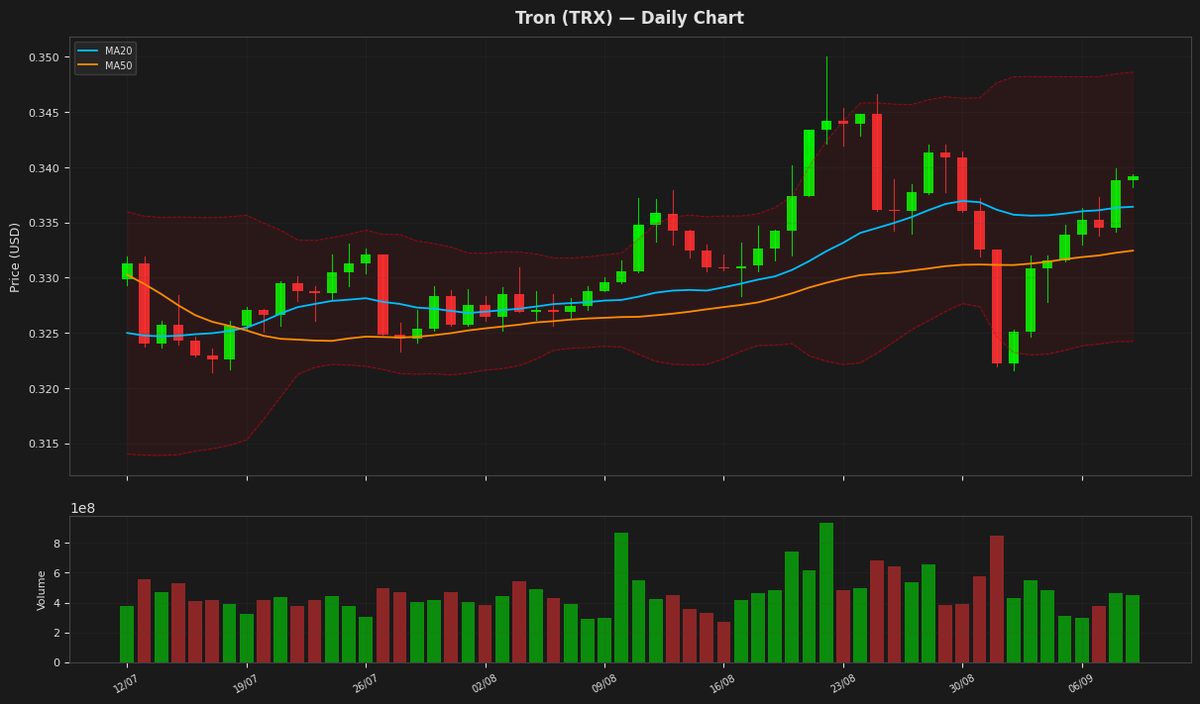
Tron's price is currently at $0.339214, showing a slight increase of 0.12% and trading near the middle of the Bollinger Bands. The RSI is at 53.696094, indicating a neutral market sentiment, while the MACD is above its signal line, suggesting a potential bullish trend. The Average True Range is relatively low at 0.004773, indicating stable price movements.
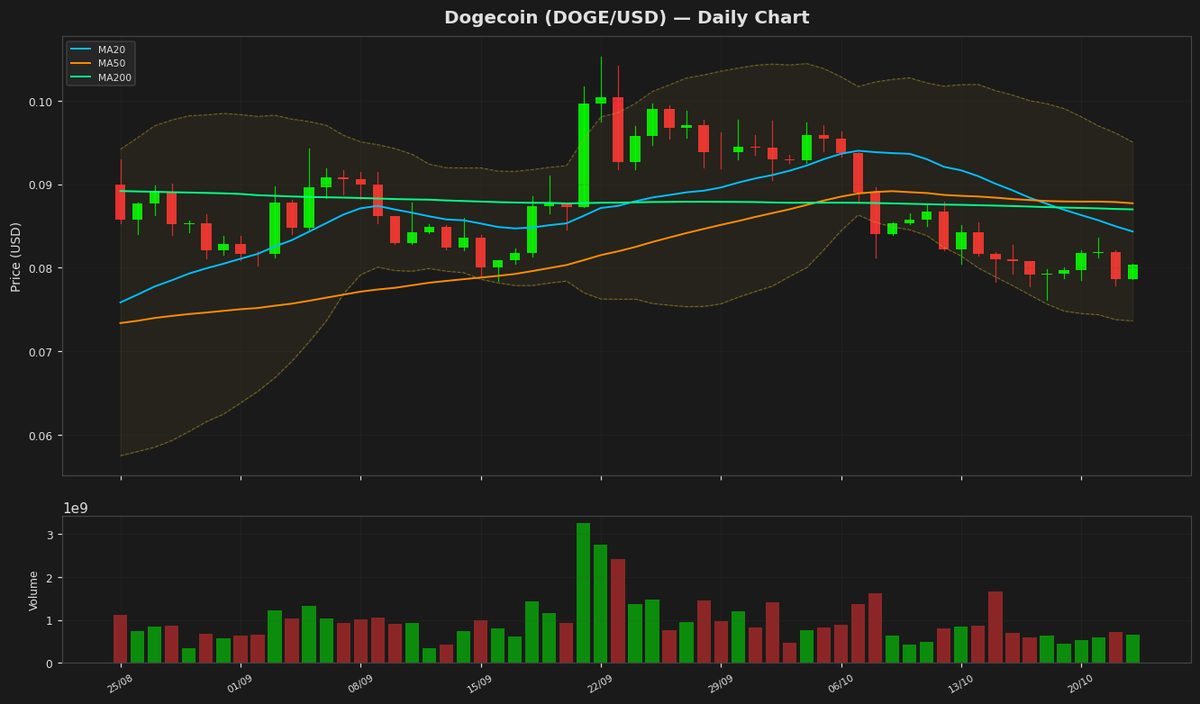
Dogecoin (DOGE) — +1.32%
$0.091180 52W: $0.067973 — $0.156091
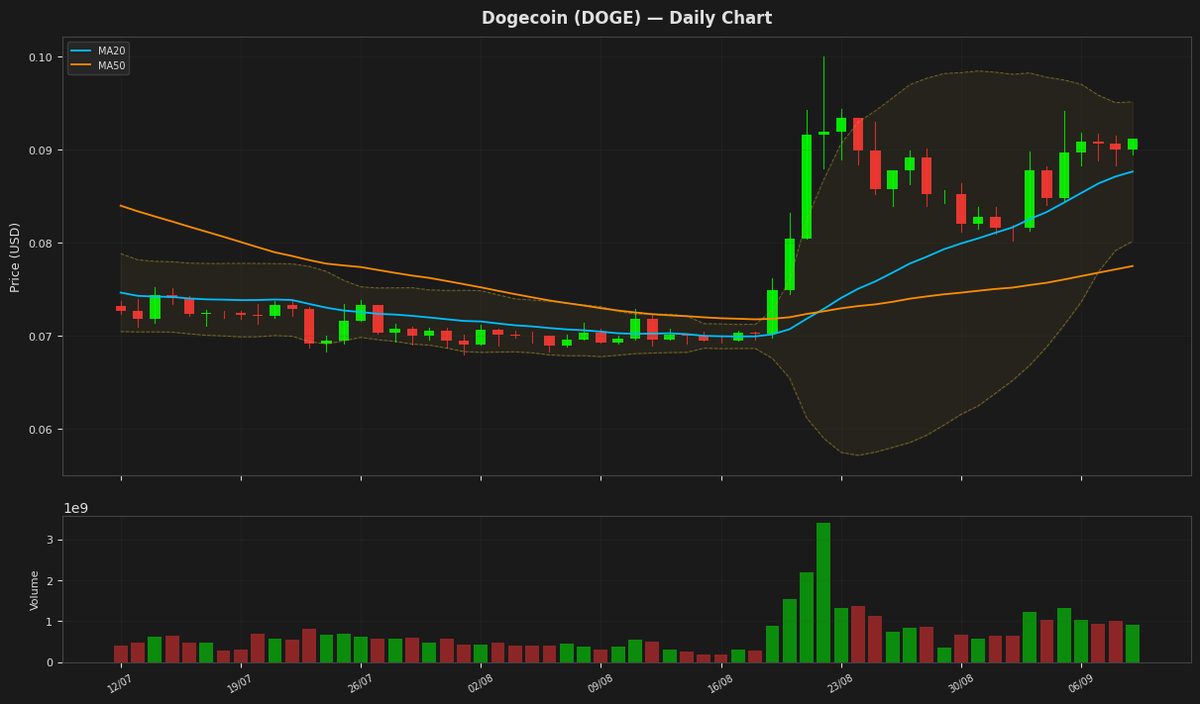
Dogecoin's price is currently trading above its 20-day and 50-day moving averages, indicating a bullish trend. The RSI is nearing the neutral zone, suggesting moderate buying pressure. The MACD is above its signal line, indicating a potential continuation of the uptrend. The Bollinger Bands suggest that the price is nearing the upper band, potentially indicating overbought conditions.
Disclaimer
The content on MarketsFN.com is provided for educational and informational purposes only. It does not constitute financial advice or investment recommendations. All investments involve risk. Past performance does not guarantee future results.