Crypto Market Sees Gains: Ripple, BNB, and Ethereum Lead the Charge
QuoteReporter
•5 min read
Crypto Market Report | October 21, 2026
📊 Crypto Market Overview
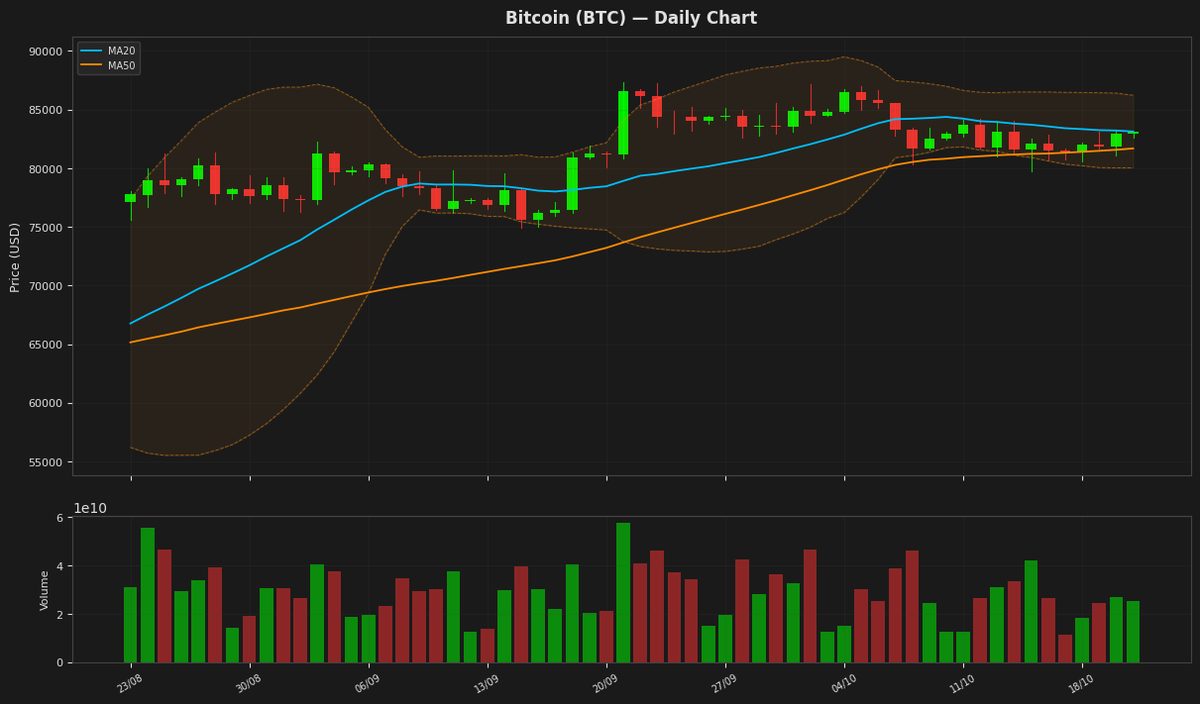
The cryptocurrency market is currently exhibiting a neutral sentiment, with most major assets experiencing minor price fluctuations. Bitcoin is trading at $83,120, having risen by 0.22% over the past 24 hours, while its RSI stands at 49.3, indicating a balanced market. The MACD is at 93.3332, suggesting a relatively stable trend.
Other key cryptocurrencies are also showing modest movements, with Ethereum up 0.26% to $2,452.99, Ripple increasing by 0.72% to $1.3440, and BNB rising by 0.71% to $746.06. Solana and Dogecoin have seen smaller gains, while Tron has dipped slightly.
From a technical perspective, several major assets are displaying oversold conditions, with Solana's RSI at 30.8 and Dogecoin's at 33.7. Ethereum, Ripple, and BNB are also in relatively oversold territory, with RSI values below 40.
The macroeconomic context is influenced by various developments, including the continued outflows from Ether ETFs, which have now exceeded $1 billion in October. Meanwhile, institutional interest in blockchain technology is evident, with Malaysia's central bank launching a DLT platform for tokenized bonds. The regulatory landscape is also evolving, with the Utah Attorney General suing a prediction market company and Bitwise and Hyperliquid seeking SEC rule changes for token trading and airdrops.
Notable technical signals include the MACD values for several major assets, which are largely negative, indicating a potential for further downward movement in the short term. However, the overall market remains relatively stable, with most assets experiencing minor price movements. The recent hack of Qubic's blockchain and subsequent restart has also drawn attention to security concerns within the crypto space. Overall, the market is currently characterized by a mix of minor price movements and ongoing developments in the regulatory and technological landscape.
📰 Crypto News
- Ether ETF outflows continue, pass $1B in October so far
- Here’s what happened in crypto today
- Malaysia central bank launches DLT platform for tokenized bonds
- Tech giants rush to block 8 eMudhra certs that could enable fake sites
- Musk says SpaceX-Tesla merger a ‘good idea’ as AI revenue jumps ninefold
- Qubic restarts blockchain, opens recovery claims after $1.4M hack
- Utah AG sues Kalshi, pursues profits from prediction market company
- Bitwise, Hyperliquid seek SEC rule changes for token trading, airdrops
- Zcash developers confirm November date for upgrade that triples payment speed
- Ripple brings Wall Street into 24/7 stock bets, but HSBC warns markets are still thin
- Solana’s Alpenglow, its biggest network overhaul since 2020, goes live Wednesday
- A company that vouches for websites had secret keys so weak that 8 of them were cracked
- Bitcoin hovers around $83,000 as AI earnings revive tech, ZEC jumps 11%
- U.S. CFTC sets agenda for AI forum, exploring trading and agentic finance
- People Are Vibe Coding the Ads Out of Their Smart TVs: Here's How
🔍 Technical Analysis
Bitcoin (BTC) — +0.22%
$83,120.36 52W: $57,747.77 — $87,363.76
Bitcoin is trading near its 20-day moving average at $83,127, indicating a lack of clear direction. The Relative Strength Index (RSI) at 49.34 suggests a neutral market sentiment, neither overbought nor oversold. The price is currently within the Bollinger Bands, with the upper band at $86,221 and lower band at $80,034, indicating moderate volatility. The MACD is below its signal line, suggesting a potential bearish signal.
Ethereum (ETH) — +0.26%
$2,452.99 52W: $1,506.51 — $2,805.50
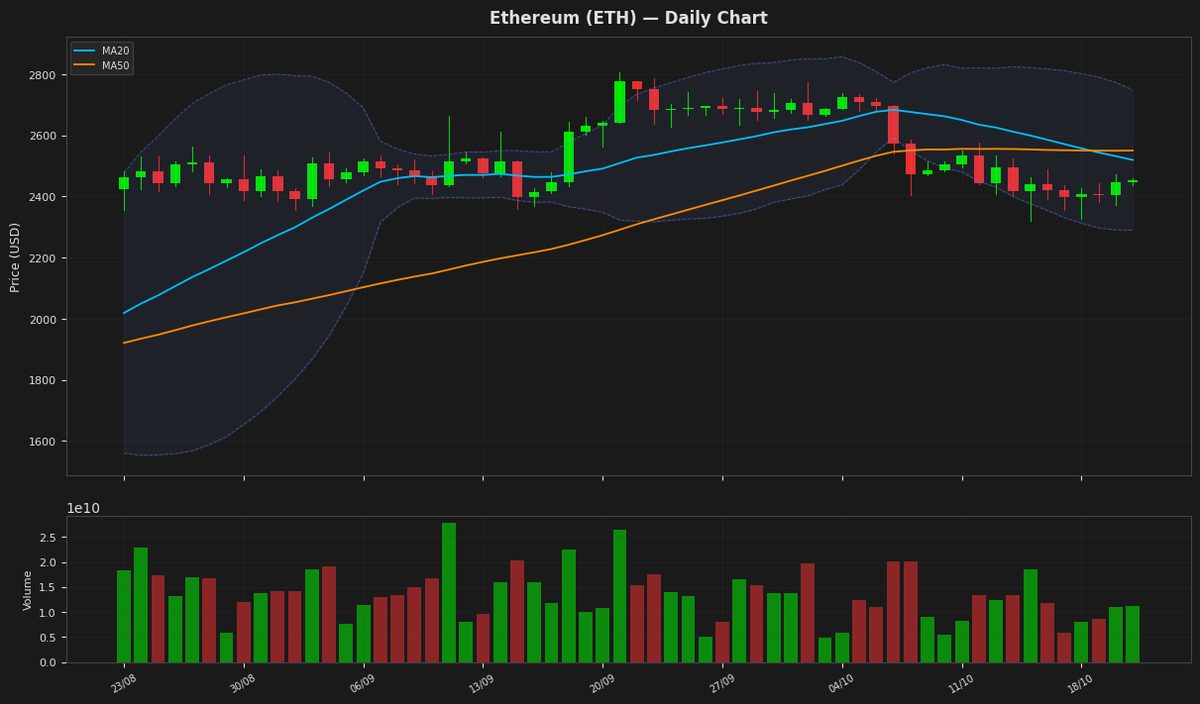
Ethereum's price is currently at $2,452.99, showing a slight increase of 0.26% for the day, and is positioned below both its 20-day and 50-day moving averages, indicating a bearish trend. The Relative Strength Index (RSI) at 38.17 suggests the asset is nearing oversold territory, while the MACD line below the signal line reinforces the bearish sentiment. The price is also within the lower half of the Bollinger Bands, with the upper band at $2,749.22 and lower band at $2,290.05.
Ripple (XRP) — +0.72%
$1.3440 52W: $0.988422 — $1.6838
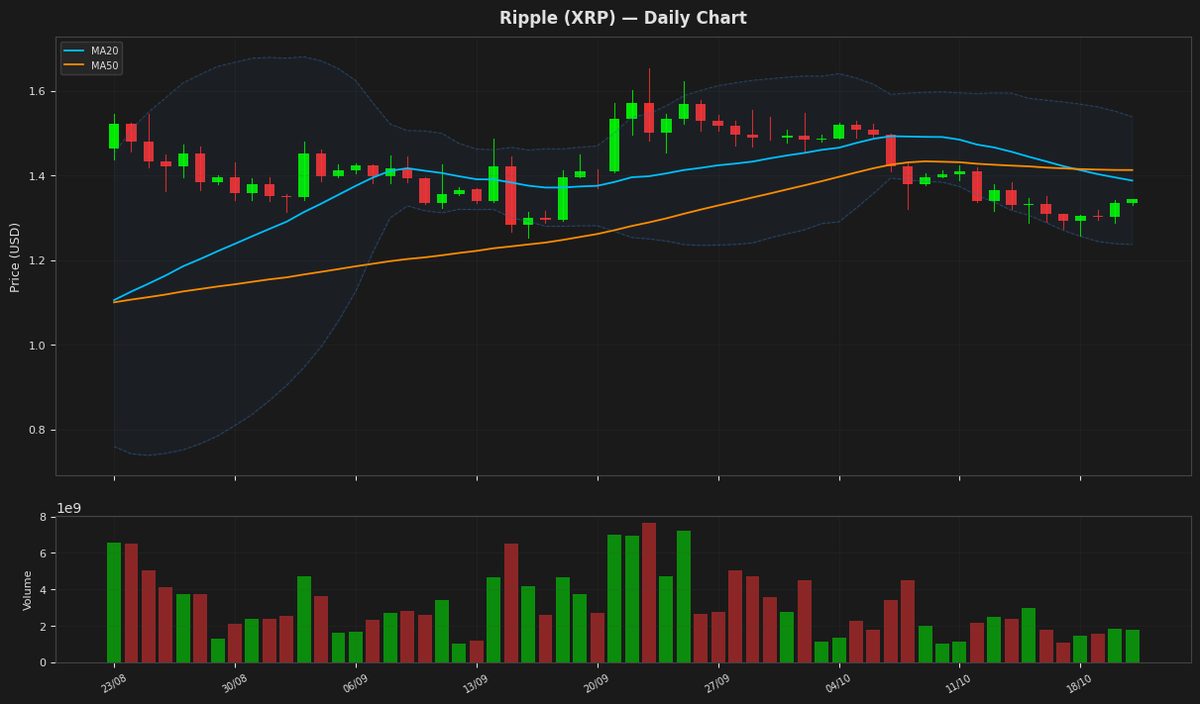
Ripple's price is currently at $1.344, showing a slight increase, and is positioned near the lower end of its recent trading range, with the Bollinger Band lower boundary at $1.237. The RSI indicates oversold conditions, suggesting a potential for a bounce. The MACD is below its signal line, indicating a bearish signal, but the negative divergence is not significant. The ATR suggests moderate volatility.
Solana (SOL) — +0.11%
$106.5400 52W: $60.4147 — $124.6174
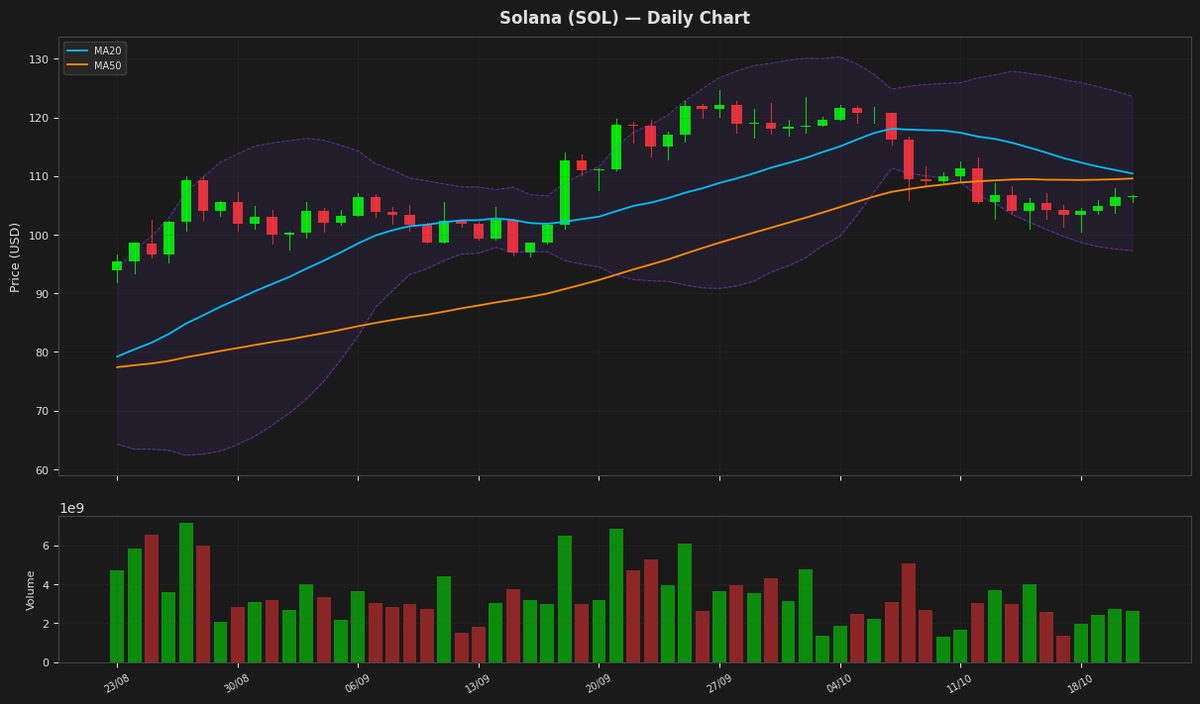
Solana's price is currently at $106.54, showing a marginal increase of 0.11%. The RSI(14) value of 30.78 indicates that the asset is nearing oversold territory, while the MACD line is below the signal line, suggesting a bearish trend. The price is also below both MA20 and MA50, and close to the lower Bollinger Band at $97.29, indicating potential support nearby.
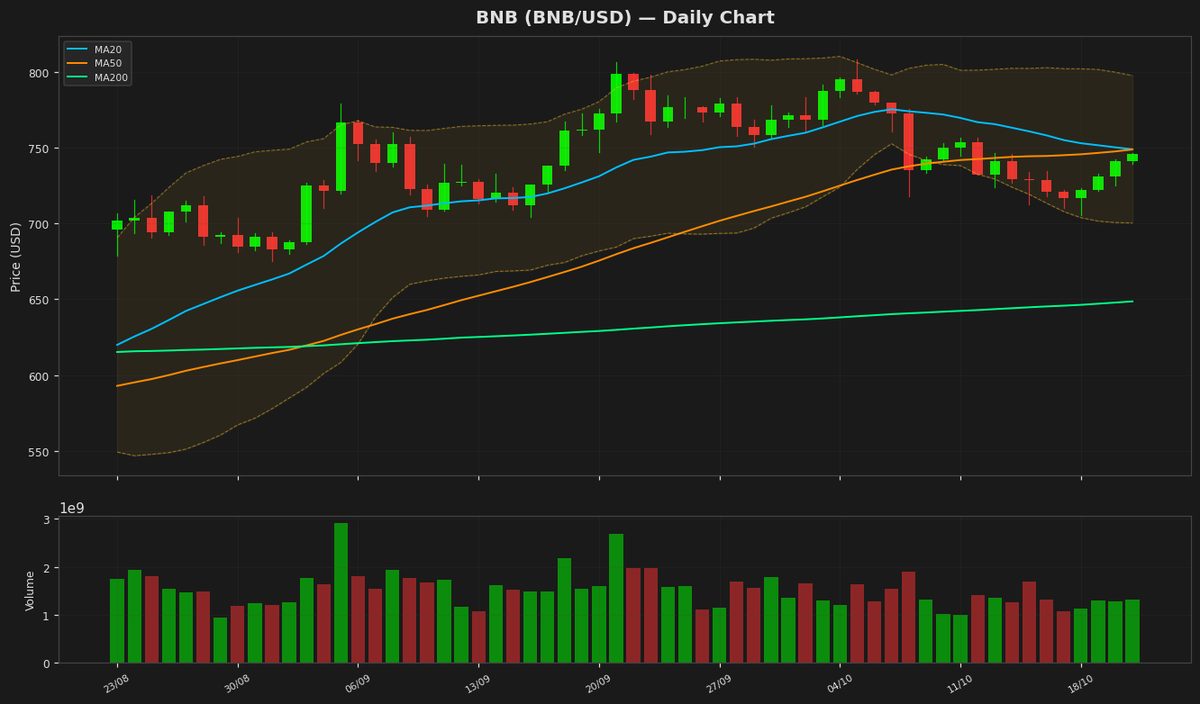
BNB (BNB) — +0.71%
$746.0600 52W: $538.5992 — $808.4329
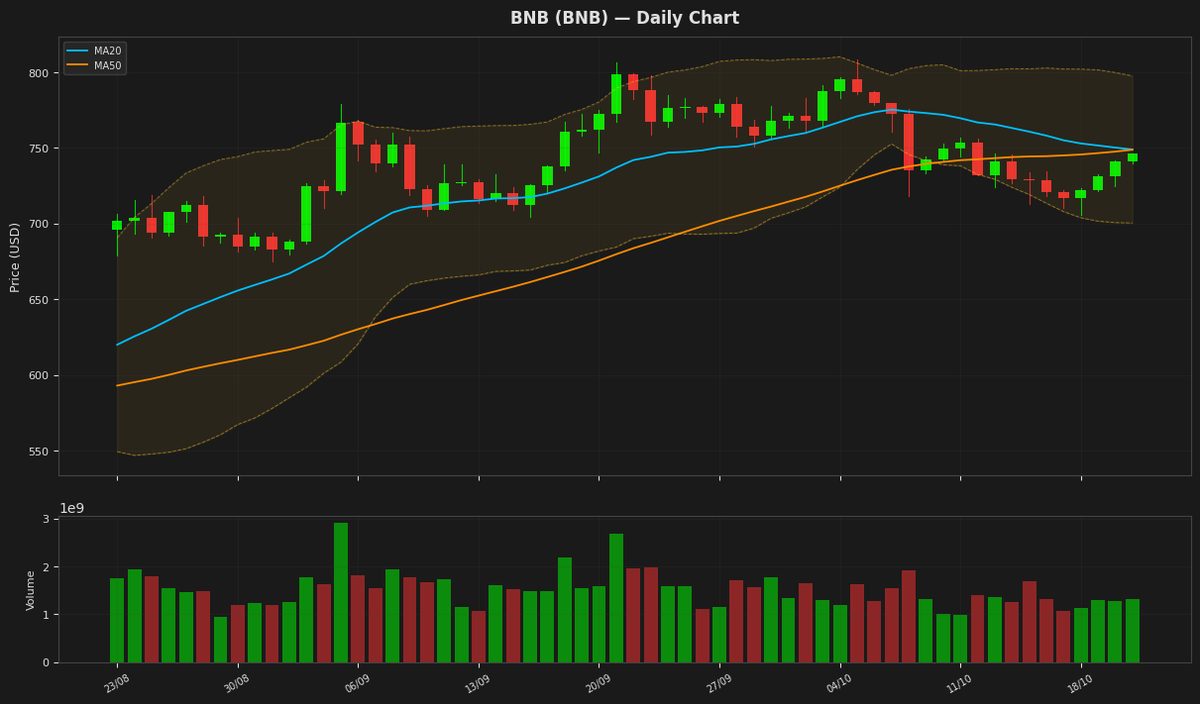
BNB is currently trading at $746.06, slightly below its MA20 and MA50, indicating a neutral short-term trend. The RSI is at 40.56, suggesting that the asset is nearing oversold territory, while the MACD is below its signal line, indicating a bearish signal. The price is also near the lower end of the Bollinger Bands, with the lower band at $700.35, indicating potential support.
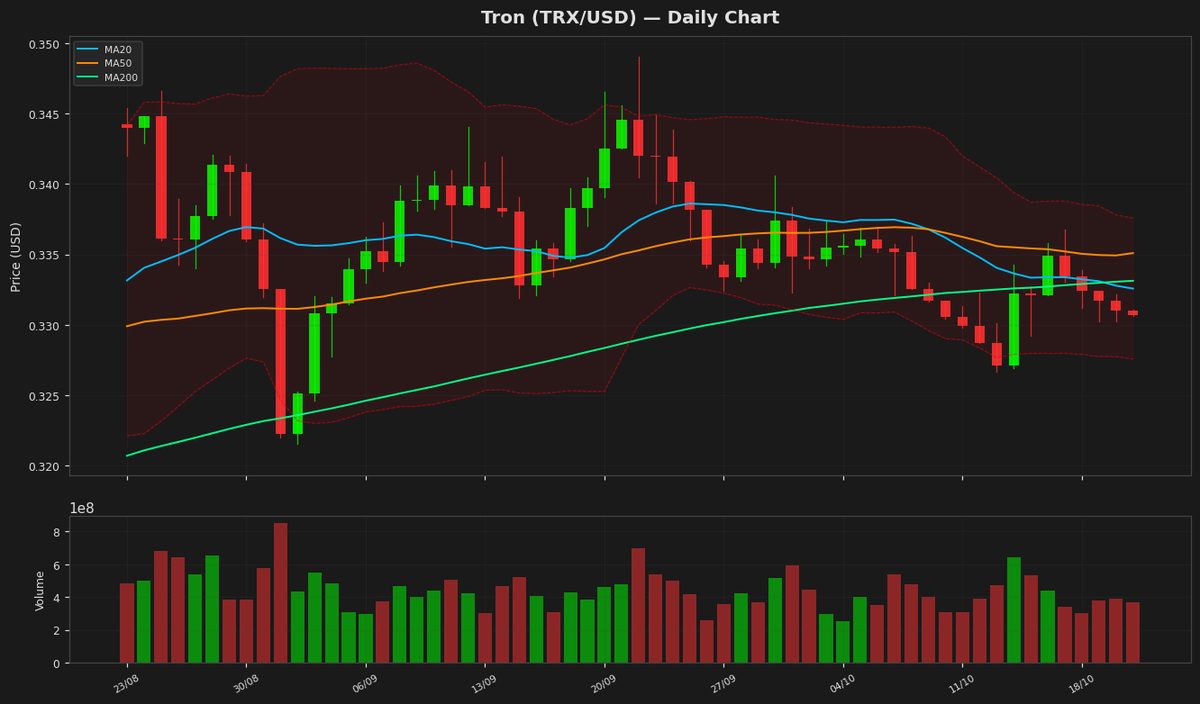
Tron (TRX) — -0.09%
$0.330743 52W: $0.276161 — $0.376332
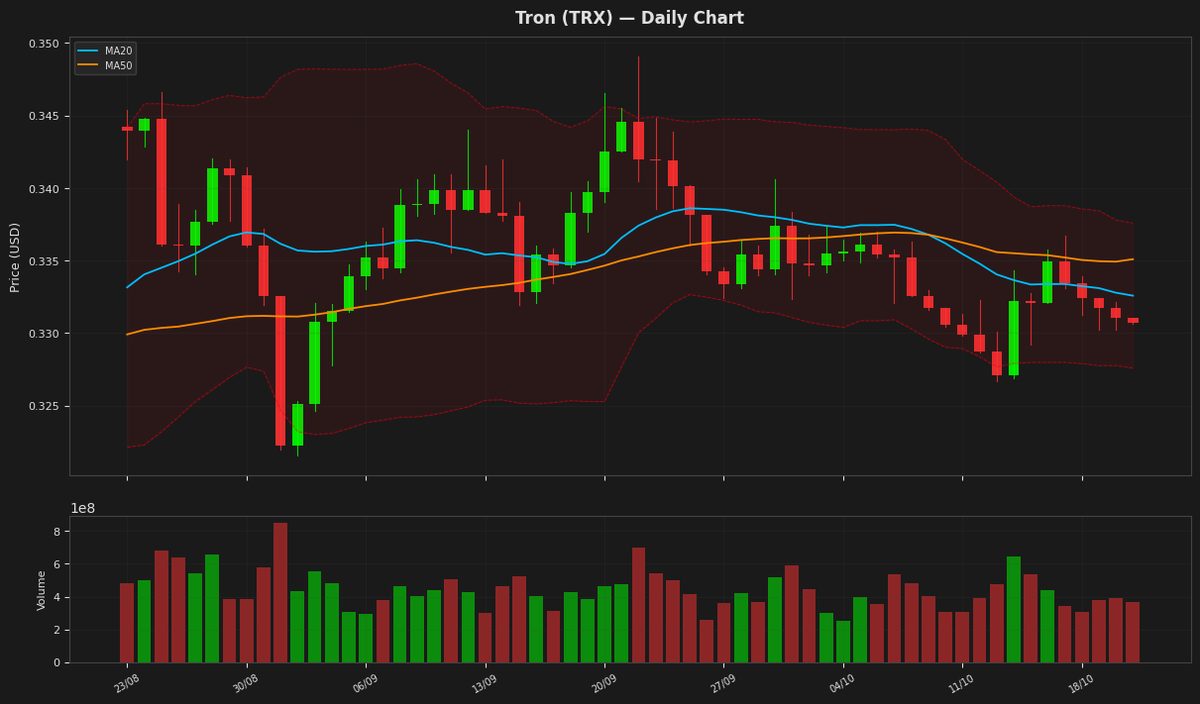
Tron's price is currently at $0.330743, showing a minor decline, and is positioned near the lower Bollinger Band at $0.327577, indicating potential support. The Relative Strength Index (RSI) at 39.079103 suggests that TRX is approaching oversold territory, while the MACD is below its signal line, indicating a bearish signal. The Average True Range (ATR) of 0.002888 indicates low volatility.
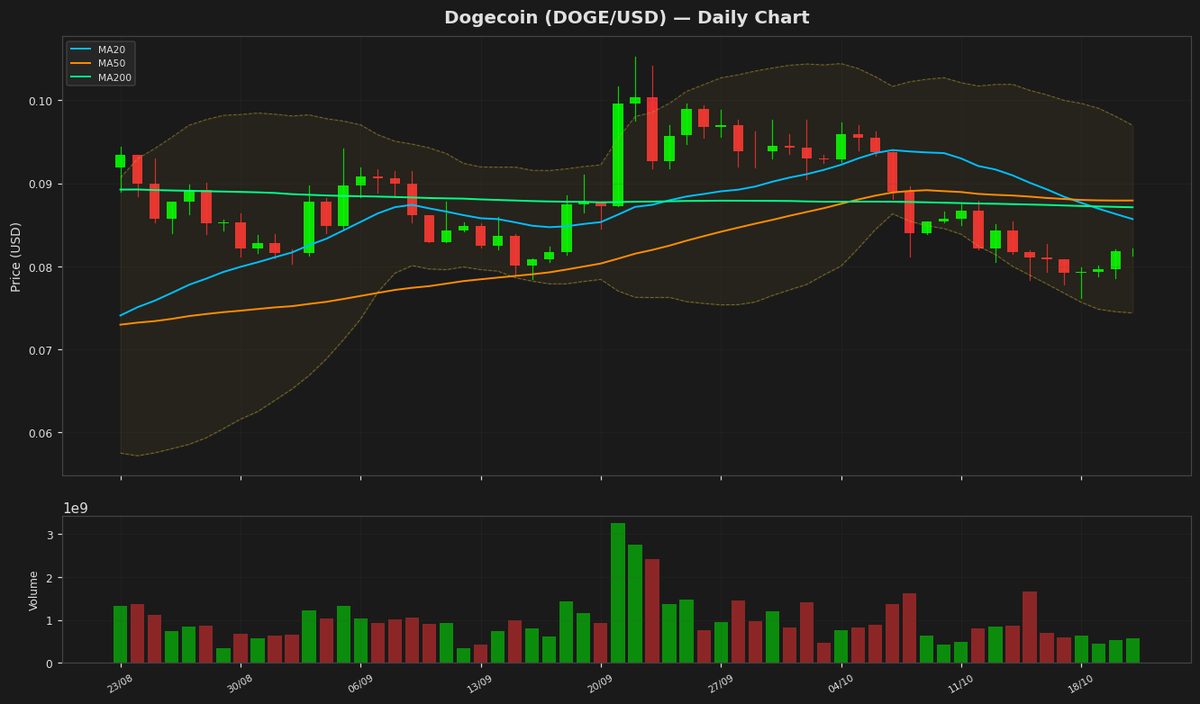
Dogecoin (DOGE) — +0.04%
$0.081840 52W: $0.067973 — $0.118255
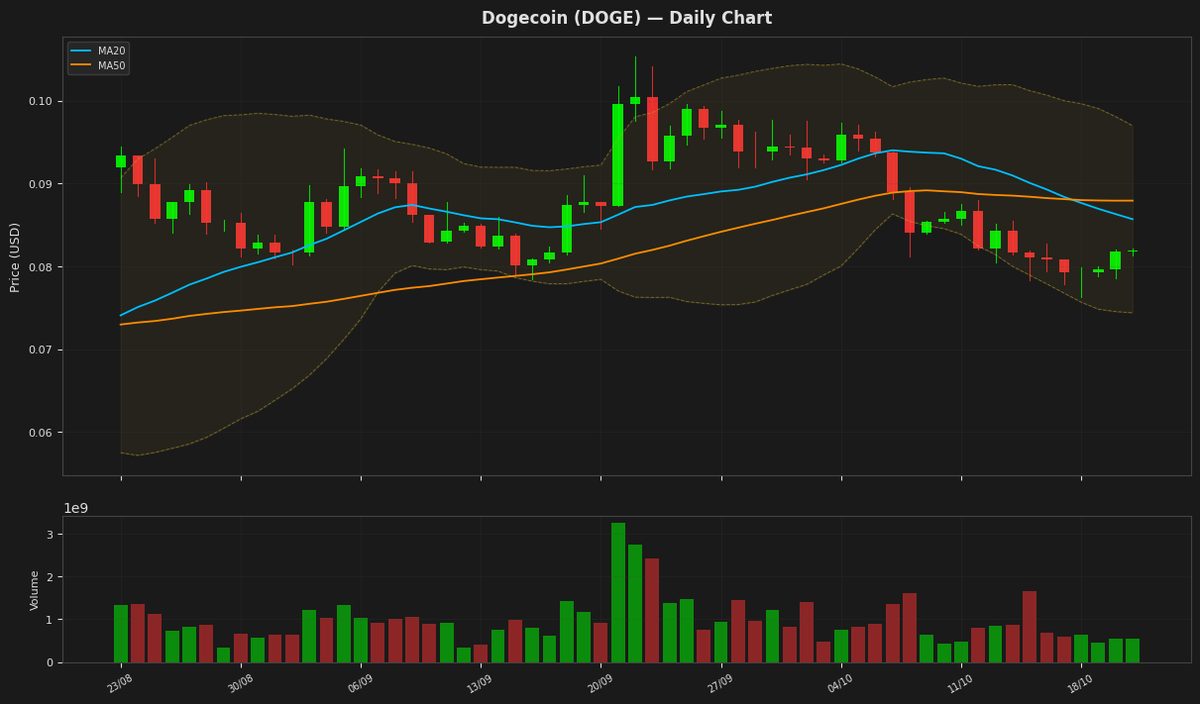
Dogecoin's price is currently at $0.081840, showing a minimal daily change, and is positioned below both its MA20 and MA50, indicating a downtrend. The RSI is at 33.728636, suggesting the cryptocurrency is approaching oversold territory. The MACD is below its signal line, reinforcing the bearish sentiment, while the price is nearing the lower Bollinger Band at 0.074386.
Disclaimer
The content on MarketsFN.com is provided for educational and informational purposes only. It does not constitute financial advice or investment recommendations. All investments involve risk. Past performance does not guarantee future results.