Crypto Market Sees Gains Led by BNB, Dogecoin, and Ripple Surge
QuoteReporter
•5 min read
Crypto Market Report | October 23, 2026
📊 Crypto Market Overview
The cryptocurrency market is currently displaying a mixed sentiment, with most major assets experiencing modest gains. Bitcoin is trading at $81,686.50, up 0.46% on the day, while Ethereum has risen 0.80% to $2,405.17. Other notable gainers include BNB, which has increased by 2.03% to $745.27, and Dogecoin, up 1.58% to $0.0799.
The relative strength index (RSI) for the top cryptocurrencies is generally in the neutral to oversold territory, suggesting a potential for consolidation or a bounce. Bitcoin's RSI is at 46.8, while Ethereum's is at 42.2. The MACD indicators for the major assets are mostly in negative territory, indicating a bearish trend in the short term.
The macroeconomic context is influencing the crypto market, with the recent outflow of $635 million from Bitcoin ETFs contributing to the cautious sentiment. The delay in Ethereum's Glamsterdam Hoodi testnet launch due to security risks is also worth noting. On the other hand, developments such as Malaysia and Thailand joining Singapore's cross-border stablecoin initiative and the upcoming launch of Switzerland's first retail spot Bitcoin ETF in November are highlighting the growing interest in cryptocurrency and blockchain technology.
From a technical perspective, the RSI and MACD indicators are providing mixed signals. While the RSI values are generally low, indicating potential oversold conditions, the MACD indicators are mostly negative, suggesting a continuation of the short-term bearish trend. Overall, the market is currently in a state of flux, with various factors influencing the price movements of the major cryptocurrencies.
📰 Crypto News
- Malaysia, Thailand join Singapore’s cross-border stablecoin push
- Bitcoin ETFs bleed $635M as October slides back into the red
- Here’s what happened in crypto today
- Ethereum delays Glamsterdam Hoodi testnet launch over security risks
- Bitcoin Core changes security policy as AI makes bugs easier to find
- Switzerland’s first retail spot Bitcoin ETF targets November launch
- Pentagon bans US forces from using military info to bet in prediction markets
- New DeepSeek ban in US, Swiss-Asia crypto ties deepen: Asia Express
- Circle shareholder sues Trump, World Liberty and Steve Witkoff over crypto deals
- Dune launches real-time data feeds covering 200 onchain trading venues
- India's largest exchange denies hack after sleuths pointed to $16 million in suspicious outflows
- Polymarket has reportedly fired its marketing chief, also a close friend of the CEO
- Ethereum delays Glamsterdam test after security devs flag risk to existing contracts
- Cardano holders are being asked to bet $5 million on copper hitting a new record
- Bitcoin, gold trim early losses as yen gives up gains. Oil stays near $100
🔍 Technical Analysis
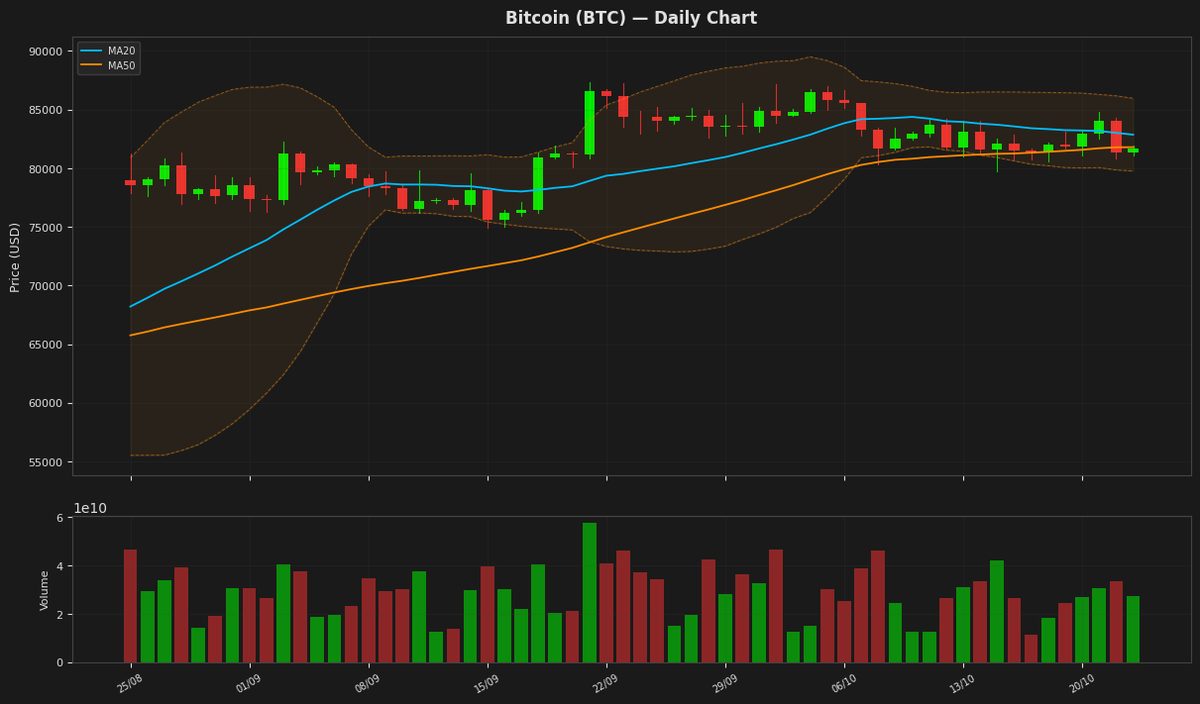
Bitcoin (BTC) — +0.46%
$81,686.50 52W: $57,747.77 — $87,363.76
Bitcoin is currently trading at $81,686.50 with a minor daily gain of 0.46%, indicating a relatively stable price action. The RSI at 46.764227 suggests a neutral to slightly oversold condition, while the MACD being below its signal line indicates a bearish signal. The price is hovering between the 20-day and 50-day moving averages, suggesting a lack of clear direction.
Ethereum (ETH) — +0.80%
$2,405.17 52W: $1,506.51 — $2,805.50
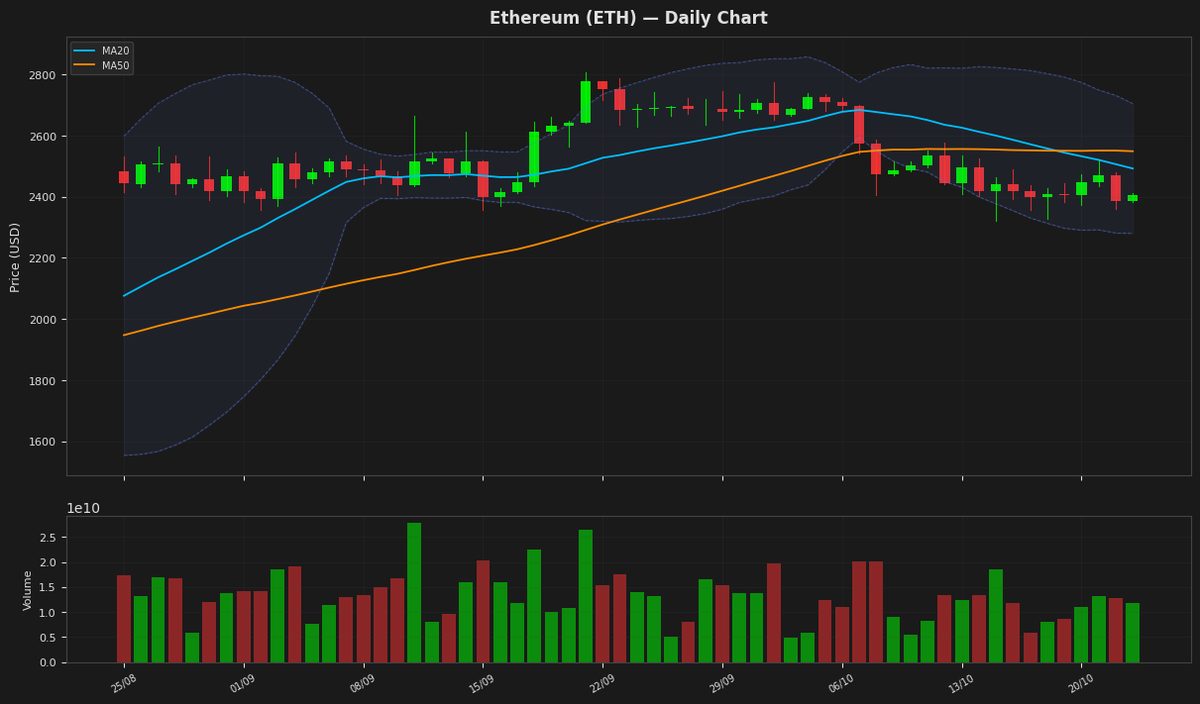
Ethereum's price is currently at $2,405, showing a slight increase, and is positioned between its 20-day and 50-day moving averages, indicating a potential consolidation phase. The Relative Strength Index (RSI) at 42.205089 suggests that the asset is nearing oversold territory, while the MACD line below the signal line indicates a bearish signal. The Bollinger Bands suggest that the price is below the midpoint, with the upper band at $2,704 and lower band at $2,280, indicating potential support and resistance levels. The Average True Range (ATR) of 92.84586 indicates moderate volatility.
Ripple (XRP) — +1.30%
$1.3247 52W: $0.988422 — $1.6838
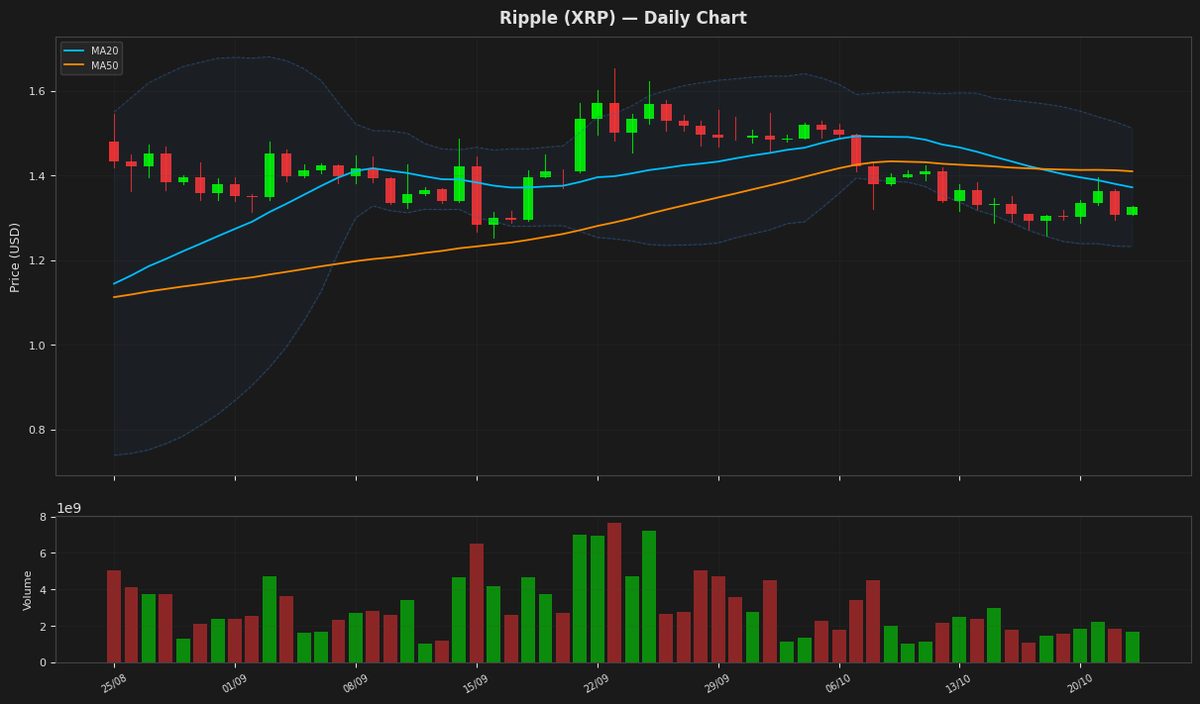
Ripple's price is currently at $1.324700, showing a slight increase of 1.30% in a day, as it trades near the lower end of its recent range, close to the lower Bollinger Band at 1.23204. The RSI is at 39.488678, indicating that the asset is not deeply oversold but has room to recover. The MACD is negative and below its signal line, suggesting bearish momentum. The ATR indicates moderate volatility.
Solana (SOL) — +0.94%
$104.5200 52W: $60.4147 — $124.6174
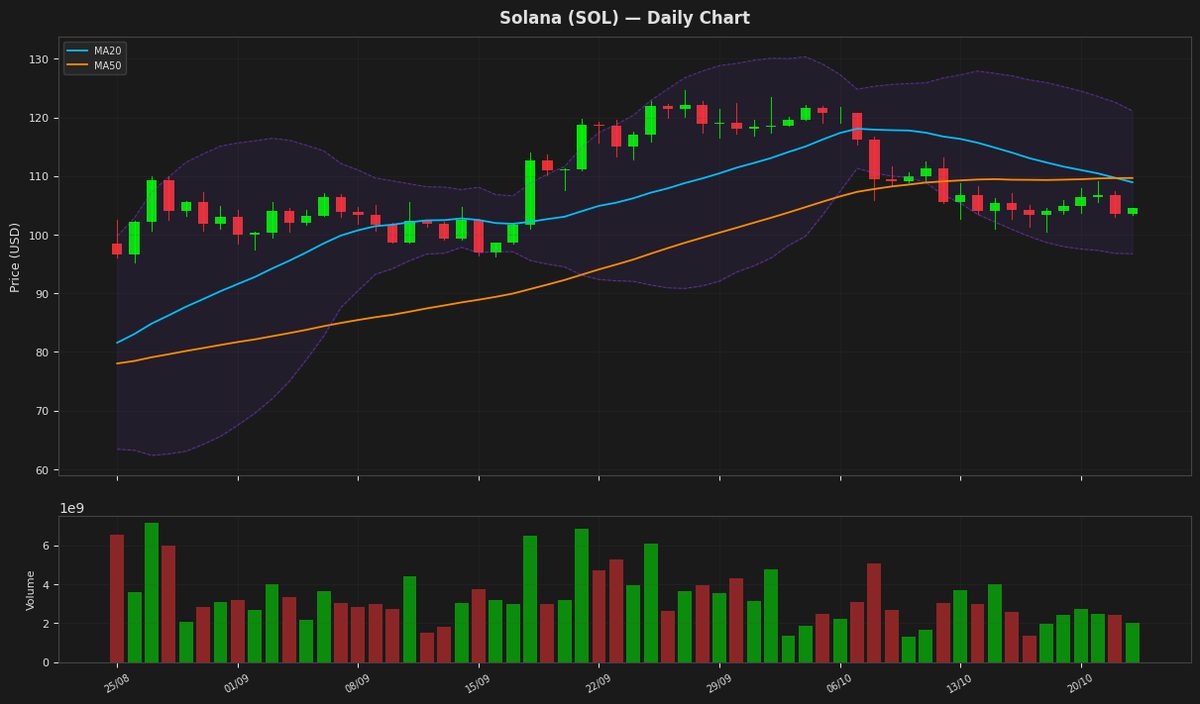
Solana's price is currently at $104.52, showing a minor increase of 0.94%. The RSI at 39.78 indicates the asset is nearing oversold territory, while the MACD line is below the signal line, suggesting a bearish trend. The price is below both the MA20 and MA50, and is closer to the lower Bollinger Band, indicating potential support around $96.76.
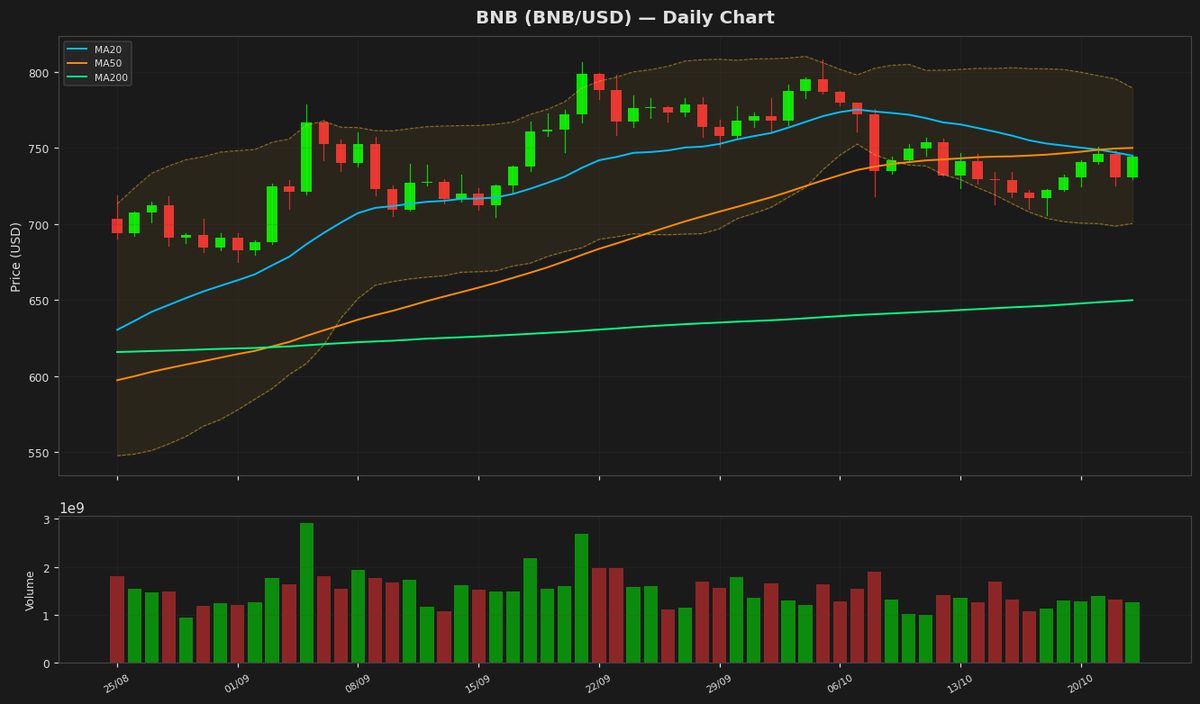
BNB (BNB) — +2.03%
$745.2700 52W: $538.5992 — $808.4329
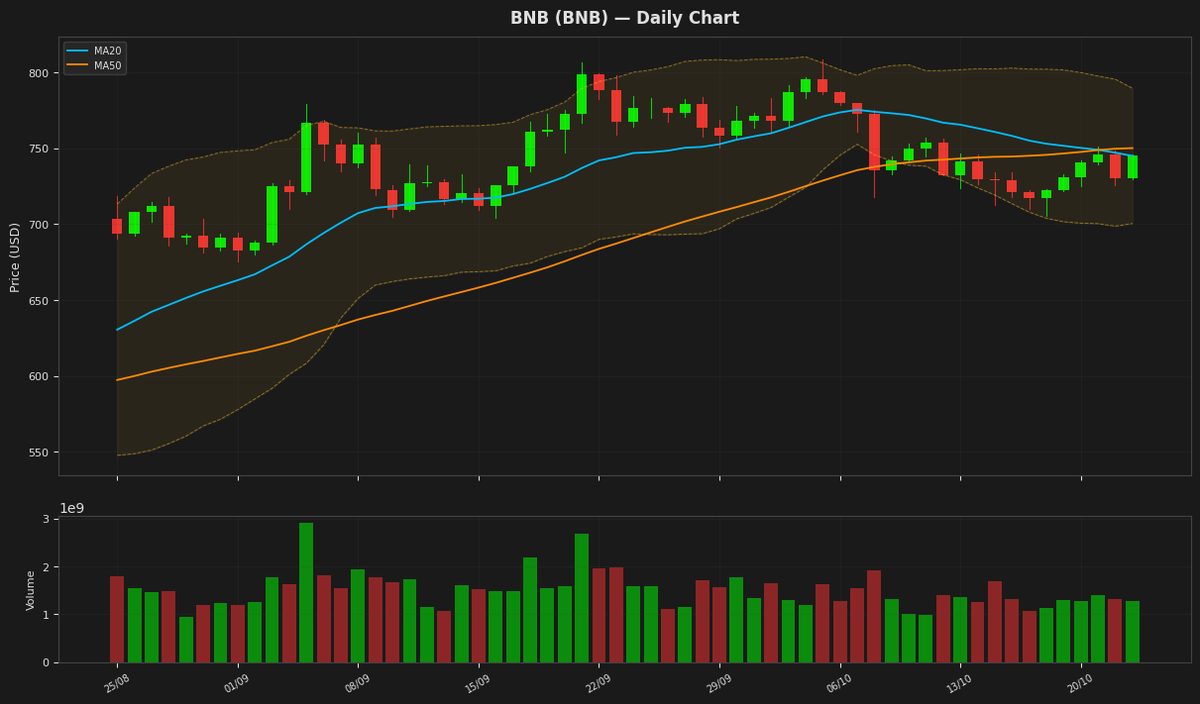
BNB is currently trading at $745.27, showing a slight increase of 2.03% in its daily price, and is positioned near its 20-day moving average of $744.96. The Relative Strength Index (RSI) at 51.27 indicates a neutral market sentiment. The price is also within the Bollinger Bands, with the upper band at $789.50 and the lower band at $700.42, suggesting a stable trend.
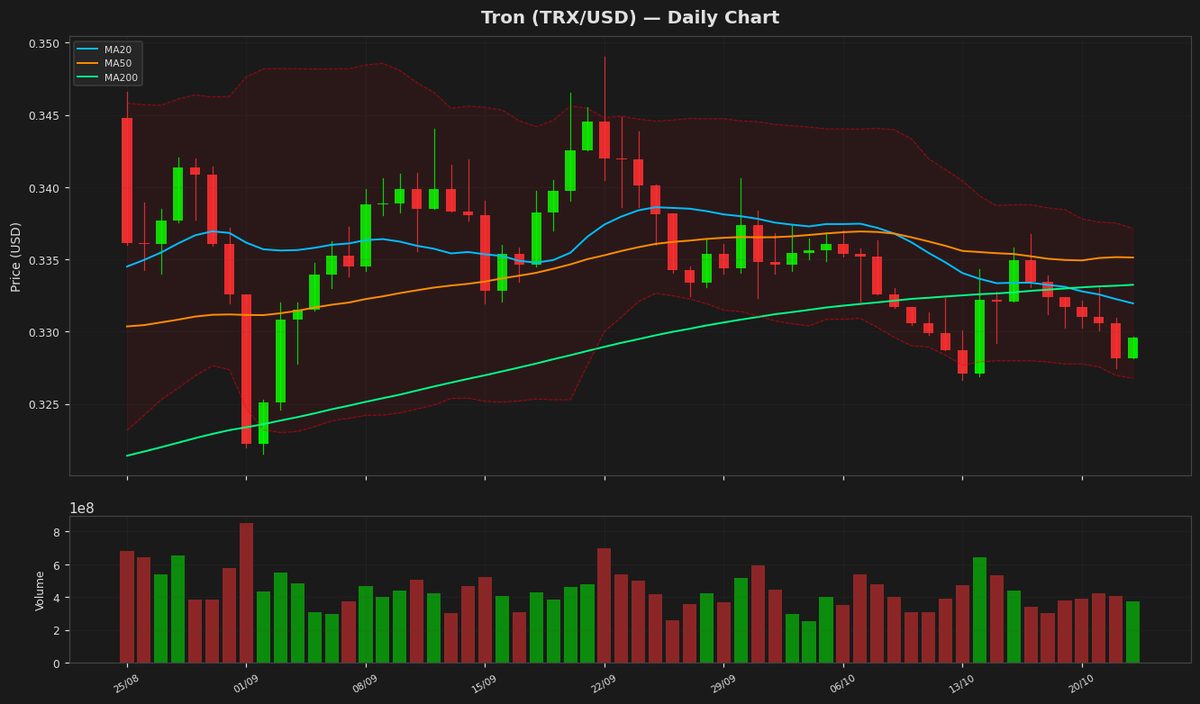
Tron (TRX) — +0.44%
$0.329613 52W: $0.278283 — $0.376332
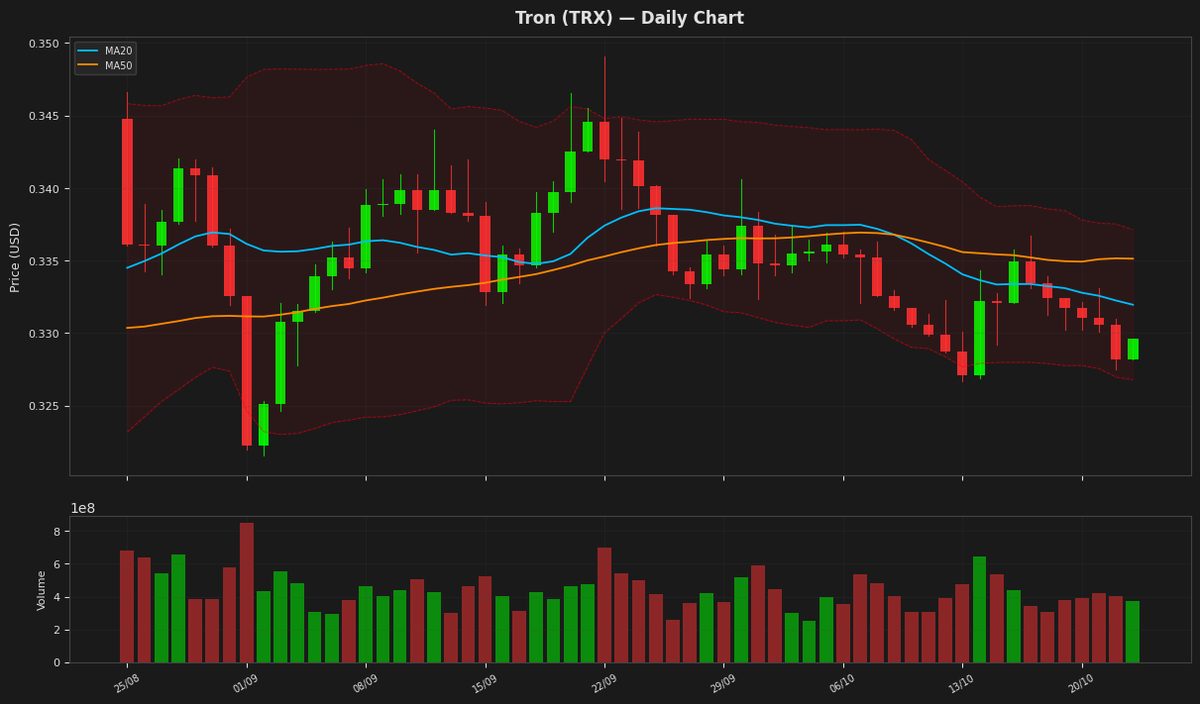
Tron's price is currently at $0.329613, showing a minor increase of 0.44% and trading near the lower end of the Bollinger Bands, with the upper and lower bands at $0.337132 and $0.326777 respectively. The RSI is at 44.941492, indicating a neutral territory, and the MACD is below the signal line, suggesting a potential bearish trend. The ATR is relatively low at 0.003058, indicating low volatility.
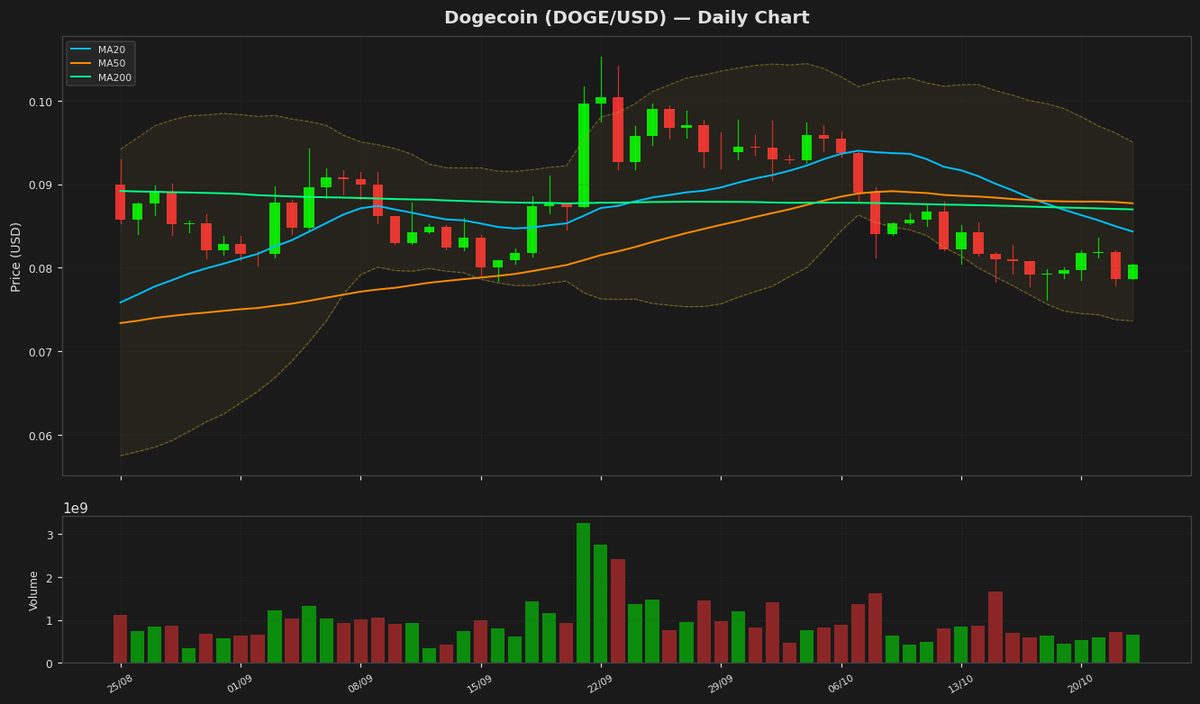
Dogecoin (DOGE) — +1.58%
$0.079920 52W: $0.067973 — $0.118255
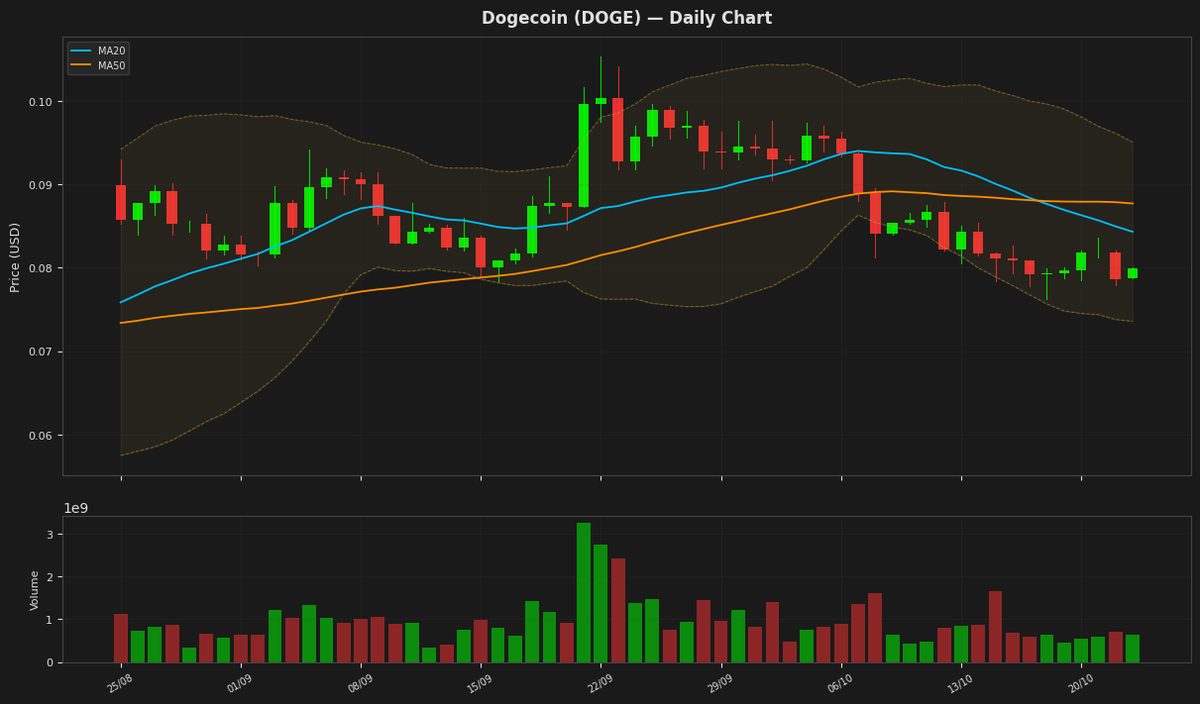
Dogecoin's current price is $0.079920, showing a daily increase of 1.58%, as it trades near the lower end of its Bollinger Bands, with the lower band at $0.073593. The RSI is at 36.51, indicating the cryptocurrency is approaching oversold territory. The MACD is negative and below its signal line, suggesting a bearish trend. The price remains below both the MA20 and MA50, indicating a downtrend.
Disclaimer
The content on MarketsFN.com is provided for educational and informational purposes only. It does not constitute financial advice or investment recommendations. All investments involve risk. Past performance does not guarantee future results.