HY spreads hold at 270bps as markets digest Fed signals amid normal regime
MarketsFN Data Team
The Option-Adjusted Spread measures the yield premium a corporate bond pays over a risk-free government bond of the same maturity — after stripping out the value of any embedded options (like call provisions). It isolates pure credit risk compensation. A wider OAS means bond investors demand more yield for holding corporate debt, signalling rising perceived risk. A tighter OAS means confidence in issuers is high and credit conditions are loose.
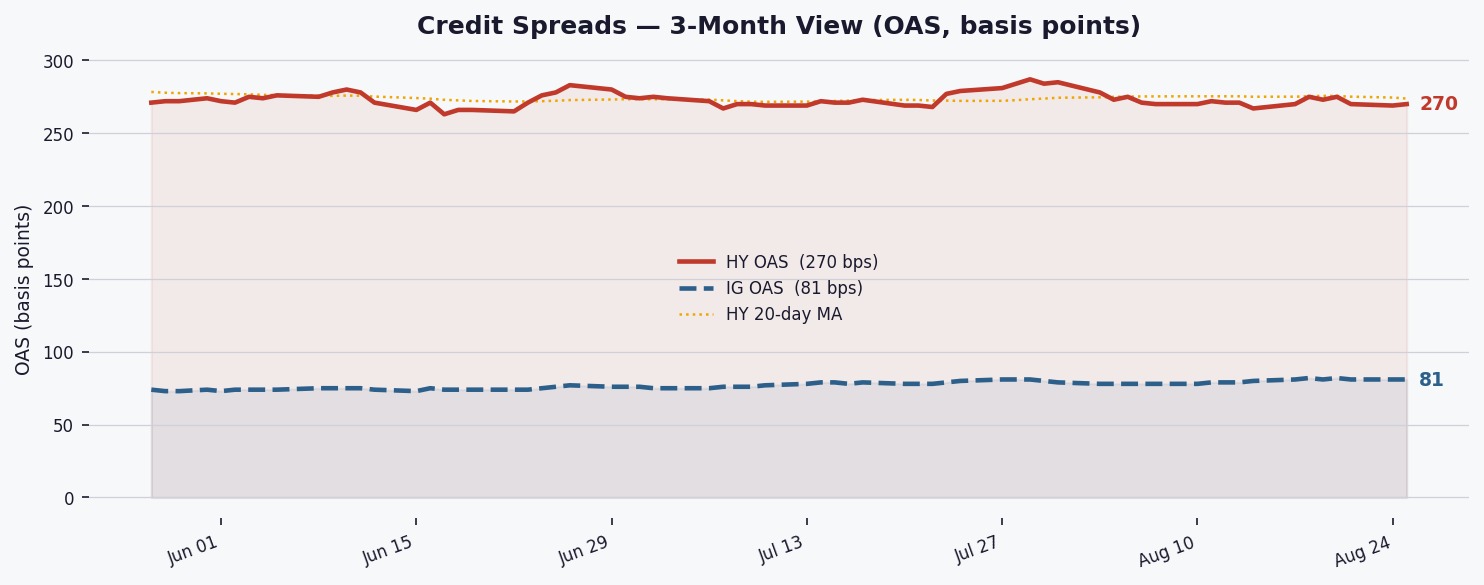
Investment Grade (IG) bonds are rated BBB−/Baa3 or above by S&P/Moody's. They represent large, financially stable companies. IG OAS is currently 81 bps. High Yield (HY) bonds are rated below BBB−/Baa3 — also called "junk bonds" — issued by companies with higher debt loads or less stable cash flows. HY OAS is 270 bps. The HY–IG gap of 189 bps is the market's price for taking extra risk.
When spreads widen (rise), investors are demanding more compensation for credit risk — often because recession fears are rising, corporate earnings are deteriorating, or liquidity is tightening. When spreads tighten (fall), risk appetite is strong: investors are willing to accept less yield premium, usually because the economic outlook is improving. Credit spreads often lead equity markets by days or weeks — they are a leading indicator of financial stress.
Historically, HY OAS has spiked before or during every US recession: ~600 bps in 2001, ~1,900 bps in 2008 (peak), ~900 bps in March 2020. The current HY OAS of 270 bps sits at the 9th percentile of the past 10 years — meaning spreads have been wider than today only 91% of the time. A sustained move above 600 bps would historically mark the threshold of serious credit stress.
High-yield spreads edged 1bp wider to 270bps today, remaining in a NORMAL regime with a widening bias, as investors weigh stable funding conditions against modest refinancing risks for leveraged issuers.
The ICE BofA HY OAS sits at 270bps (9th percentile historically tight), up 1bp DoD but down 5bp WoW, with the 20-day MA (274bps) converging toward the 60-day MA (273bps) suggesting near-term stabilization. While spreads remain below the 308bps median, the NORMAL regime implies neither compelling value nor acute stress, leaving HY in a wait-and-see phase.
Investment-grade spreads were flat at 81bps (29th percentile), with the HY-IG differential at 189bps — 35bps below its 4-year average — indicating lingering risk appetite as investors accept less compensation for stepping down in credit quality. IG's stability reflects demand for duration and liquidity amid muted volatility.
The HY effective yield of 6.99% offers a 235bp pickup over 10Y Treasuries, while the 43bp Baa-Aaa spread shows modest quality differentiation. With Moody's Baa at 6.26%, refinancing costs remain manageable for most issuers, though the 235bp credit premium leaves limited cushion for downgrade risk.

Full Statistics Dashboard
| Metric | Current | Change | Historical Rank |
|---|---|---|---|
| HY OAS (ICE BofA) | 270 bps | ▲ 1 bps DoD ▼ 5 bps WoW | 9th pct |
| IG OAS (ICE BofA) | 81 bps | ▼ 0 bps DoD ▼ 1 bps WoW | 29th pct |
| HY−IG Differential | 189 bps | 4Y avg: 224 bps ▼ 35 bps vs avg | |
| HY Effective Yield | 6.99% | over 10Y: +235 bps | |
| IG Effective Yield | 5.35% | ||
| Moody's Baa Yield | 6.26% | Baa−Aaa: 43 bps | |
| Moody's Aaa Yield | 5.83% | ||
| 10Y Treasury | 4.64% | ||
| SOFR | 3.660% | vs 3M T-Bill: ▼ 20 bps bps | |
| HY OAS Regime | NORMAL | Direction: WIDENING (20d MA 274 vs 60d MA 273 bps) | |
| 10Y HY Range | 259–461 bps | median 308 bps |
The -20bp SOFR-T-Bill spread indicates loose money-market conditions, with SOFR at 3.66% below 3M bills (3.86%). This benign funding backdrop supports credit demand but removes a catalyst for spread tightening absent growth optimism.

Watch Friday's PCE data for Fed policy clues; a sustained HY OAS move above 280bps (20-day MA +6bps) could signal a shift to WIDENING regime, while a break below 265bps would suggest renewed risk-on momentum.