Asian Session Crude Oil Report — 28 Oct 2026
QuoteReporter
WTI crude is trading at $90.86 in early Asian hours, holding near the lower bound of its recent range as the contract extends its seven-day decline to 3.96%, while Brent finds firmer footing at $103.02 with a modest overnight rebound of 0.75%. The Brent-WTI spread builds to $12.16 as European benchmark crude maintains relative strength against its U.S. counterpart. Both contracts remain entrenched in technical oversold territory, with WTI’s RSI at 22.5 and Brent at 38.9, though the latter shows early signs of stabilization after testing the psychological $100 level.
The technical landscape paints a divergent picture between the two crude markers. WTI faces sustained pressure below all key exponential moving averages, with the EMA9 at $92.34 and EMA21 at $92.90 capping upside attempts, while Brent trades in line with its EMA9 at $103.07 and holds comfortably above the EMA50 at $97.21. Pivot analysis suggests WTI is testing critical support at the pivot point of $89.46, with a break risking acceleration toward $72.17, while Brent’s immediate resistance clusters around $117.04. The term structure reinforces bearish near-term sentiment, with both benchmarks in steep backwardation—WTI’s Oct26-Jul27 spread sits at -10.8%, while Brent’s equivalent spread widens to -14.6%, reflecting tight prompt supply but weakening medium-term demand expectations.

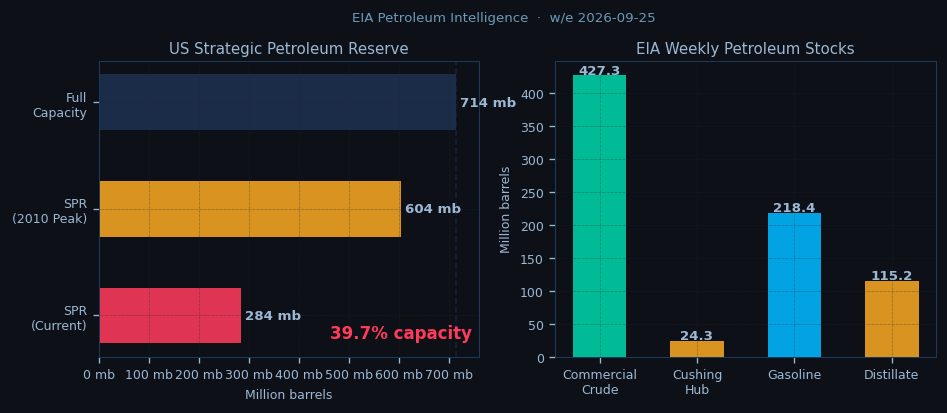
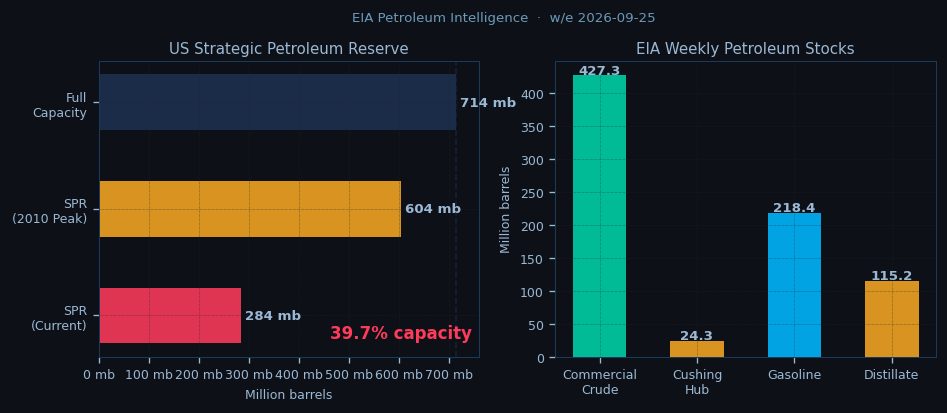
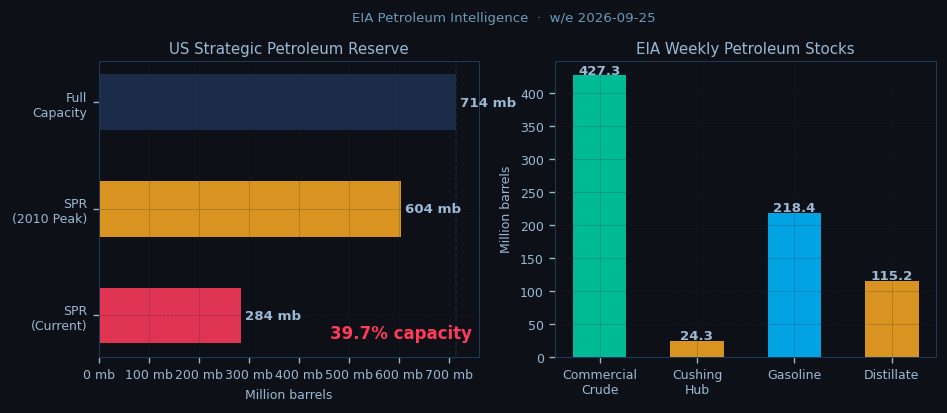
Geopolitical tensions continue to inject volatility into Asian trading, with Iranian Revolutionary Guard Corps intercepts in the Strait of Hormuz keeping risk premiums elevated as 20 million barrels per day of flows remain exposed. The Bab-el-Mandeb choke point sees increased scrutiny as Houthi forces maintain their campaign against commercial shipping, forcing VLCCs to divert via the Cape of Good Hope and adding seven days to voyage times. These disruptions partially offset bearish inventory data showing U.S. commercial crude stocks building to 427.3 million barrels amid steady production at 13.95 million barrels per day. OPEC+ discipline provides underlying support, with the group maintaining cuts through December 2026, but market participants note Iraq and Russia’s persistent overproduction against Saudi Arabia’s strict compliance.
Asian demand signals remain mixed as China’s Golden Week holiday extends through October 7, suppressing immediate regional consumption but setting the stage for a potential post-holiday inventory draw. Japanese utilities continue substituting crude for LNG amid nuclear restarts, while Indian refiners capitalize on discounted Russian barrels to maintain robust run rates. The physical market shows tentative signs of strain, with Brent’s prompt backwardation suggesting tight near-term availability despite weakening macroeconomic sentiment.
European traders should monitor whether Brent defends the $101.80 front-month level at the open, with a sustained break potentially triggering algorithmic selling toward the EMA50 at $97.21. WTI’s ability to hold above $89.46 remains critical—a failure here opens the path toward $72.17 support. The geopolitical chessboard demands attention, particularly any escalation in Hormuz transit disruptions or signs of Houthi targeting of energy shipments in the Red Sea. The session’s tone may hinge on whether Asian buyers emerge to defend these technical levels or allow the oversold conditions to extend further into the European morning.

Disclaimer
The content on MarketsFN.com is provided for educational and informational purposes only. It does not constitute financial advice, investment recommendations, or trading guidance. All investments involve risks, and past performance does not guarantee future results. You are solely responsible for your investment decisions and should conduct independent research and consult a qualified financial advisor before acting. MarketsFN.com and its authors are not liable for any losses or damages arising from your use of this information.
Related Articles
- US Session Crude Oil Report — 27 Oct 2026 — WTI crude is trading at $90.86 in the NYMEX session, testing the lower bound of its recent range as bearish momentum…
- European Session Crude Oil Report — 27 Oct 2026 — Crude oil markets hover near multi-week lows in the European session as WTI struggles below $91 while Brent holds above…
- Asian Session Crude Oil Report — 27 Oct 2026 — WTI crude hovers near $90.86 in early Asian trading, testing the lower bounds of its recent range as bearish momentum…
- US Session Crude Oil Report — 26 Oct 2026 — WTI crude holds near session lows at $90.86 as the US session struggles to find bullish momentum, testing the 200-day…
- European Session Crude Oil Report — 26 Oct 2026 — Crude oil markets enter the European session with WTI hovering near $90.86 while Brent holds above $103, as the complex…