Asian Session Crude Oil Report — 23 Oct 2026
QuoteReporter
WTI crude is trading at $90.86 in early Asian hours, holding near overnight lows as the contract extends its seven-day decline to 3.96%, while Brent shows relative resilience at $103.02 with a slight 0.75% overnight gain. The Brent-WTI spread builds to $12.16, testing the upper bound of its three-month range as European crude benchmarks outperform. Both contracts remain firmly in backwardation, with WTI’s front-to-July27 spread steepening to -10.8% and Brent’s equivalent at -14.6%, signaling persistent near-term supply anxieties despite broader demand concerns.
Technicals paint a divergent picture as WTI flirts with oversold territory—the RSI at 22.5 tests extreme lows last seen during the March 2026 banking crisis—while Brent’s 38.9 RSI suggests less downward momentum. WTI faces immediate resistance at its 50-day EMA ($90.23), with failure to hold this level risking a test of the $89.46 pivot point. Brent’s EMA alignment is more constructive, trading just below its 9-day EMA ($103.07) with the 21-day EMA ($101.63) providing dynamic support. The term structure’s backwardation steepens further, particularly for Brent, as prompt physical tightness outweighs recession fears.

Geopolitical tensions continue to underpin crude’s risk premium, with the Hormuz chokepoint remaining elevated after fresh IRGC tanker intercepts overnight. Approximately 20% of global seaborne crude flows—including all Qatari LNG exports—face disruption risks as Tehran escalates pressure ahead of renewed nuclear talks. The Bab-el-Mandeb threat level holds at “watch” with Houthi forces maintaining attacks on commercial shipping, forcing VLCCs to divert via the Cape of Good Hope at a seven-day voyage penalty. Meanwhile, OPEC+ discipline shows minor cracks as Iraq and Russia exceed quotas by 0.2 mb/d collectively, though Saudi Arabia maintains 100% compliance with its voluntary 1 mb/d cut. The group’s September output of 26.8 mb/d still trails the 27.4 mb/d call on OPEC, sustaining a 0.6 mb/d structural deficit.
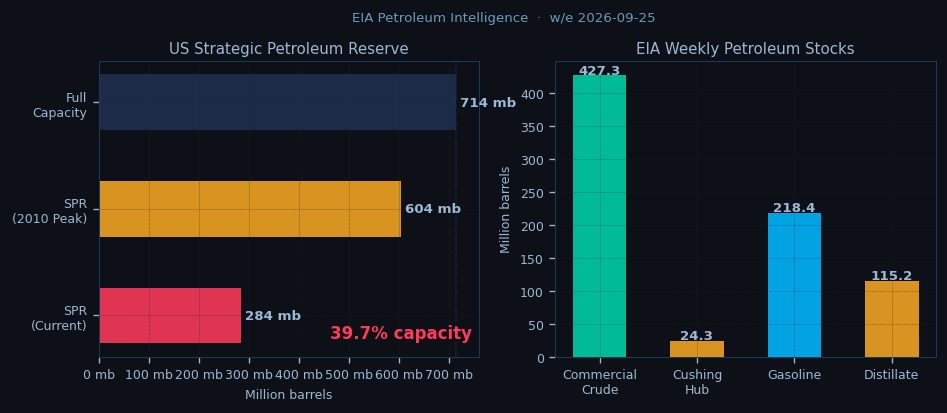
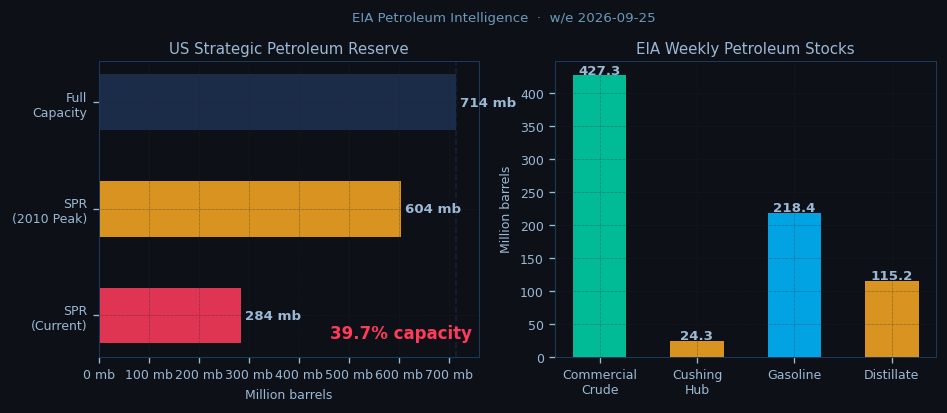
Asia-Pacific demand signals are mixed. Chinese refinery runs show tentative recovery signs after September’s 92.5% utilization rate—the highest since May—but independent teapot operators face renewed crude import quota constraints. Japanese utilities are actively swapping oil-for-gas in power generation after LNG spot prices spike above $25/MMBtu, while India’s diesel exports slip 12% WoW as domestic stockpiling accelerates ahead of harvest season. The EIA’s latest weekly data reveals a marginal 0.9 mb crude inventory build, though Cushing stocks at 24.3 mb remain precariously close to operational minimums.
European traders should monitor whether WTI defends its 50-day EMA at the NYMEX open, with a breach potentially accelerating algorithmic selling toward the $89.46 pivot. Brent’s ability to hold above $102.50—a confluence of its 21-day EMA and the 38.2% Fib of its August-September rally—will dictate near-term momentum. The spread action remains critical; any contraction below $11.50 may trigger arb-related Brent liquidation. Geopolitical watchpoints include further Hormuz escalations and whether Russia’s reported overproduction evolves into a sustained trend ahead of the October 5 OPEC+ monitoring committee meeting. The backwardation curve suggests physical markets are tightening despite macro headwinds, leaving crude caught between structural deficit and cyclical demand fears.

Disclaimer
The content on MarketsFN.com is provided for educational and informational purposes only. It does not constitute financial advice, investment recommendations, or trading guidance. All investments involve risks, and past performance does not guarantee future results. You are solely responsible for your investment decisions and should conduct independent research and consult a qualified financial advisor before acting. MarketsFN.com and its authors are not liable for any losses or damages arising from your use of this information.
Related Articles
- US Session Crude Oil Report — 22 Oct 2026 — WTI crude is trading at $90.86 in early New York trade, testing the lower bounds of its weekly range as the contract…
- Philippines Earthquake Disrupts Nickel Supply — Earthquake Disrupts Nickel Supply in the Philippines On October 21, 2026, a magnitude 5.2 earthquake struck 68 km…
- European Session Crude Oil Report — 22 Oct 2026 — Crude oil markets trade mixed in the European session as Brent holds above $103 while WTI struggles below $91, with the…
- US Session Crude Oil Report — 21 Oct 2026 — WTI crude hovers near $90.86 in early New York trade, testing the lower bounds of its weekly range as bearish momentum…
- Timor Leste Earthquake Pressures Nickel Prices — Earthquake in Timor Leste: Nickel Supply Chain Concerns Today, a magnitude 5.1 earthquake struck 164 km northeast of…