Wheat: Up 2.4% to $699.25 — Bullish Structure — Above MA50 & MA200
QuoteReporter
•2 min read
Wheat: Up 2.4% to $699.25 — Bullish Structure — Above MA50 & MA200
Analysis Date: August 21, 2026
📊 Current Market Data
CURRENT PRICE
$699.25
DAILY CHANGE
+2.42%
WEEKLY CHANGE
+3.63%
52W HIGH
$711.25
52W LOW
$492.25
💡 Key Market Factors
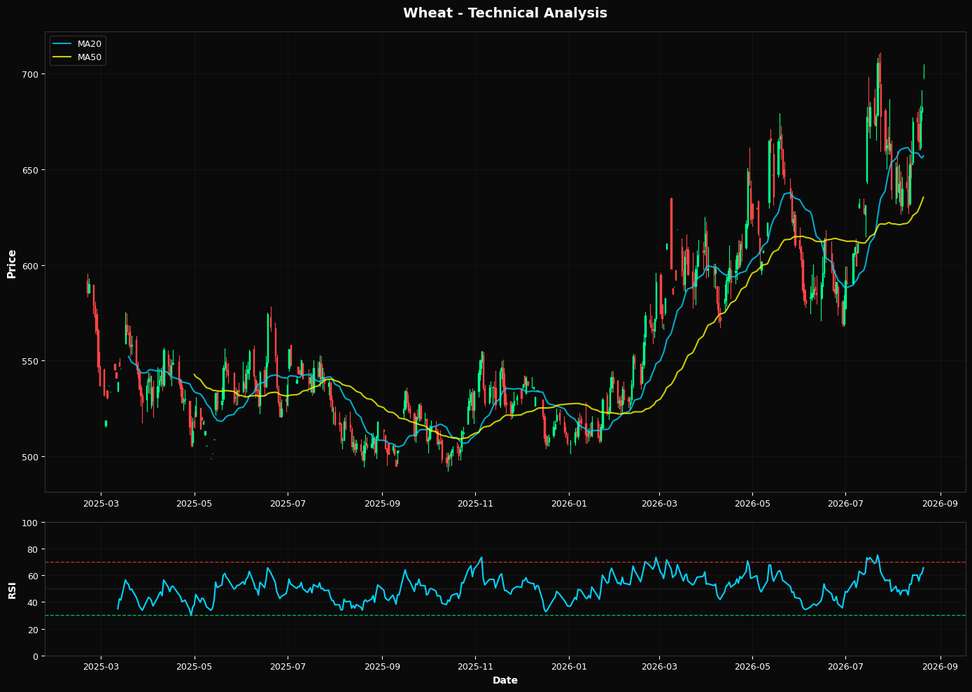
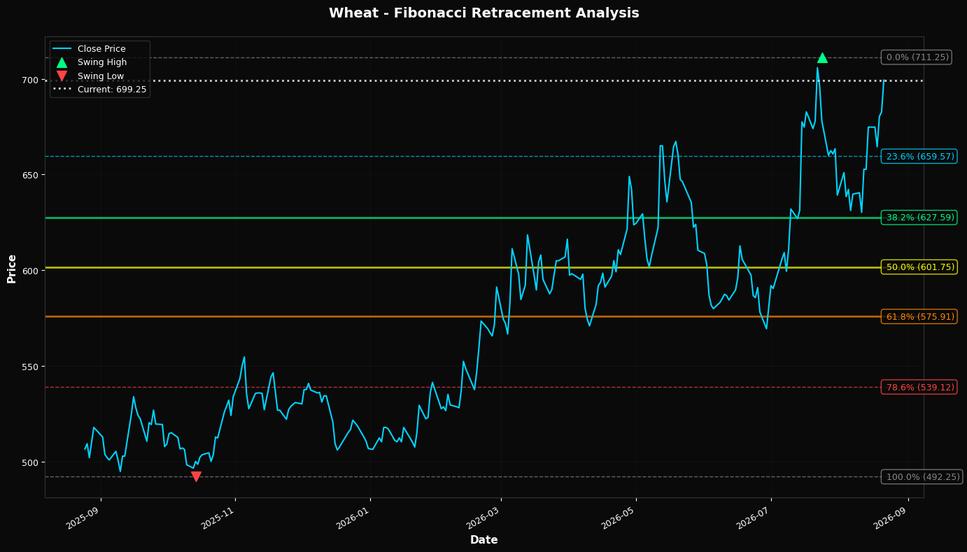
**Wheat Prices Poised for Further Gains Amid Inflationary Pressures** The most pressing macro driver for wheat prices today is inflation, which continues to exert upward pressure on commodity prices. As inflation remains elevated, the purchasing power of the dollar diminishes, making dollar-denominated commodities like wheat more attractive to international buyers. This dynamic is particularly relevant now, as wheat prices have risen to $699.25, marking a daily increase of +2.42% and a weekly gain of +3.63%. The Federal Reserve's current stance on interest rates, which remains relatively hawkish, has not yet significantly dampened inflationary pressures, suggesting that wheat prices could continue to benefit from this macroeconomic environment. From a technical perspective, wheat is showing bullish momentum. The Relative Strength Index (RSI) stands at 65.6, indicating that the commodity is nearing overbought territory but still has room to climb before hitting extreme levels. The current price of $699.25 is well above the 20-day moving average of $657.06, the 50-day moving average of $635.44, and the 200-day moving average of $584.26, underscoring a strong upward trend. The nearest Fibonacci support level at 38.2% is at $627.59, suggesting that any pullbacks could find strong buying interest at this level. Given these technical indicators, the directional bias for wheat remains firmly upward, with potential to challenge the 52-week high of $711.25. A key risk or catalyst that could alter the current bullish outlook for wheat is geopolitical developments affecting major wheat-producing regions. For instance, any escalation in tensions in the Black Sea region, a critical area for wheat exports, could disrupt supply chains and push prices higher. Conversely, a resolution or easing of such tensions could alleviate supply concerns and cap further price increases. The market may be underpricing the potential for sudden geopolitical shifts, which could lead to rapid price adjustments. Looking forward, the next significant data point to watch is the upcoming U.S. Consumer Price Index (CPI) report. A higher-than-expected inflation reading could further bolster wheat prices by reinforcing the inflationary narrative, while a lower reading might temper the current bullish momentum. This report will be crucial in confirming whether the inflationary pressures that have supported wheat's recent gains will persist or begin to wane.📈 Technical Indicators Summary
RSI (14)
65.6
50-Day MA
$635.44
200-Day MA
$584.26
Fib Level
38.2%
📊 Technical Analysis Chart (18-Month View)
📐 Fibonacci Retracement Analysis
🎯 Key Trading Levels
Key Fibonacci Levels:
- 38.2%: $627.59
- 50.0%: $601.75
- 61.8%: $575.91
Support: $492.25 (Swing Low), $635.44 (50-Day MA)
Resistance: $711.25 (Swing High)
Disclaimer
The content on MarketsFN.com is provided for educational and informational purposes only. It does not constitute financial advice, investment recommendations, or trading guidance. All investments involve risks, and past performance does not guarantee future results. You are solely responsible for your investment decisions and should conduct independent research and consult a qualified financial advisor before acting. MarketsFN.com and its authors are not liable for any losses or damages arising from your use of this information.