USD/ZAR: Up 0.47% to 16.6075 — Bullish — Above Key MAs
MarketsFN Team
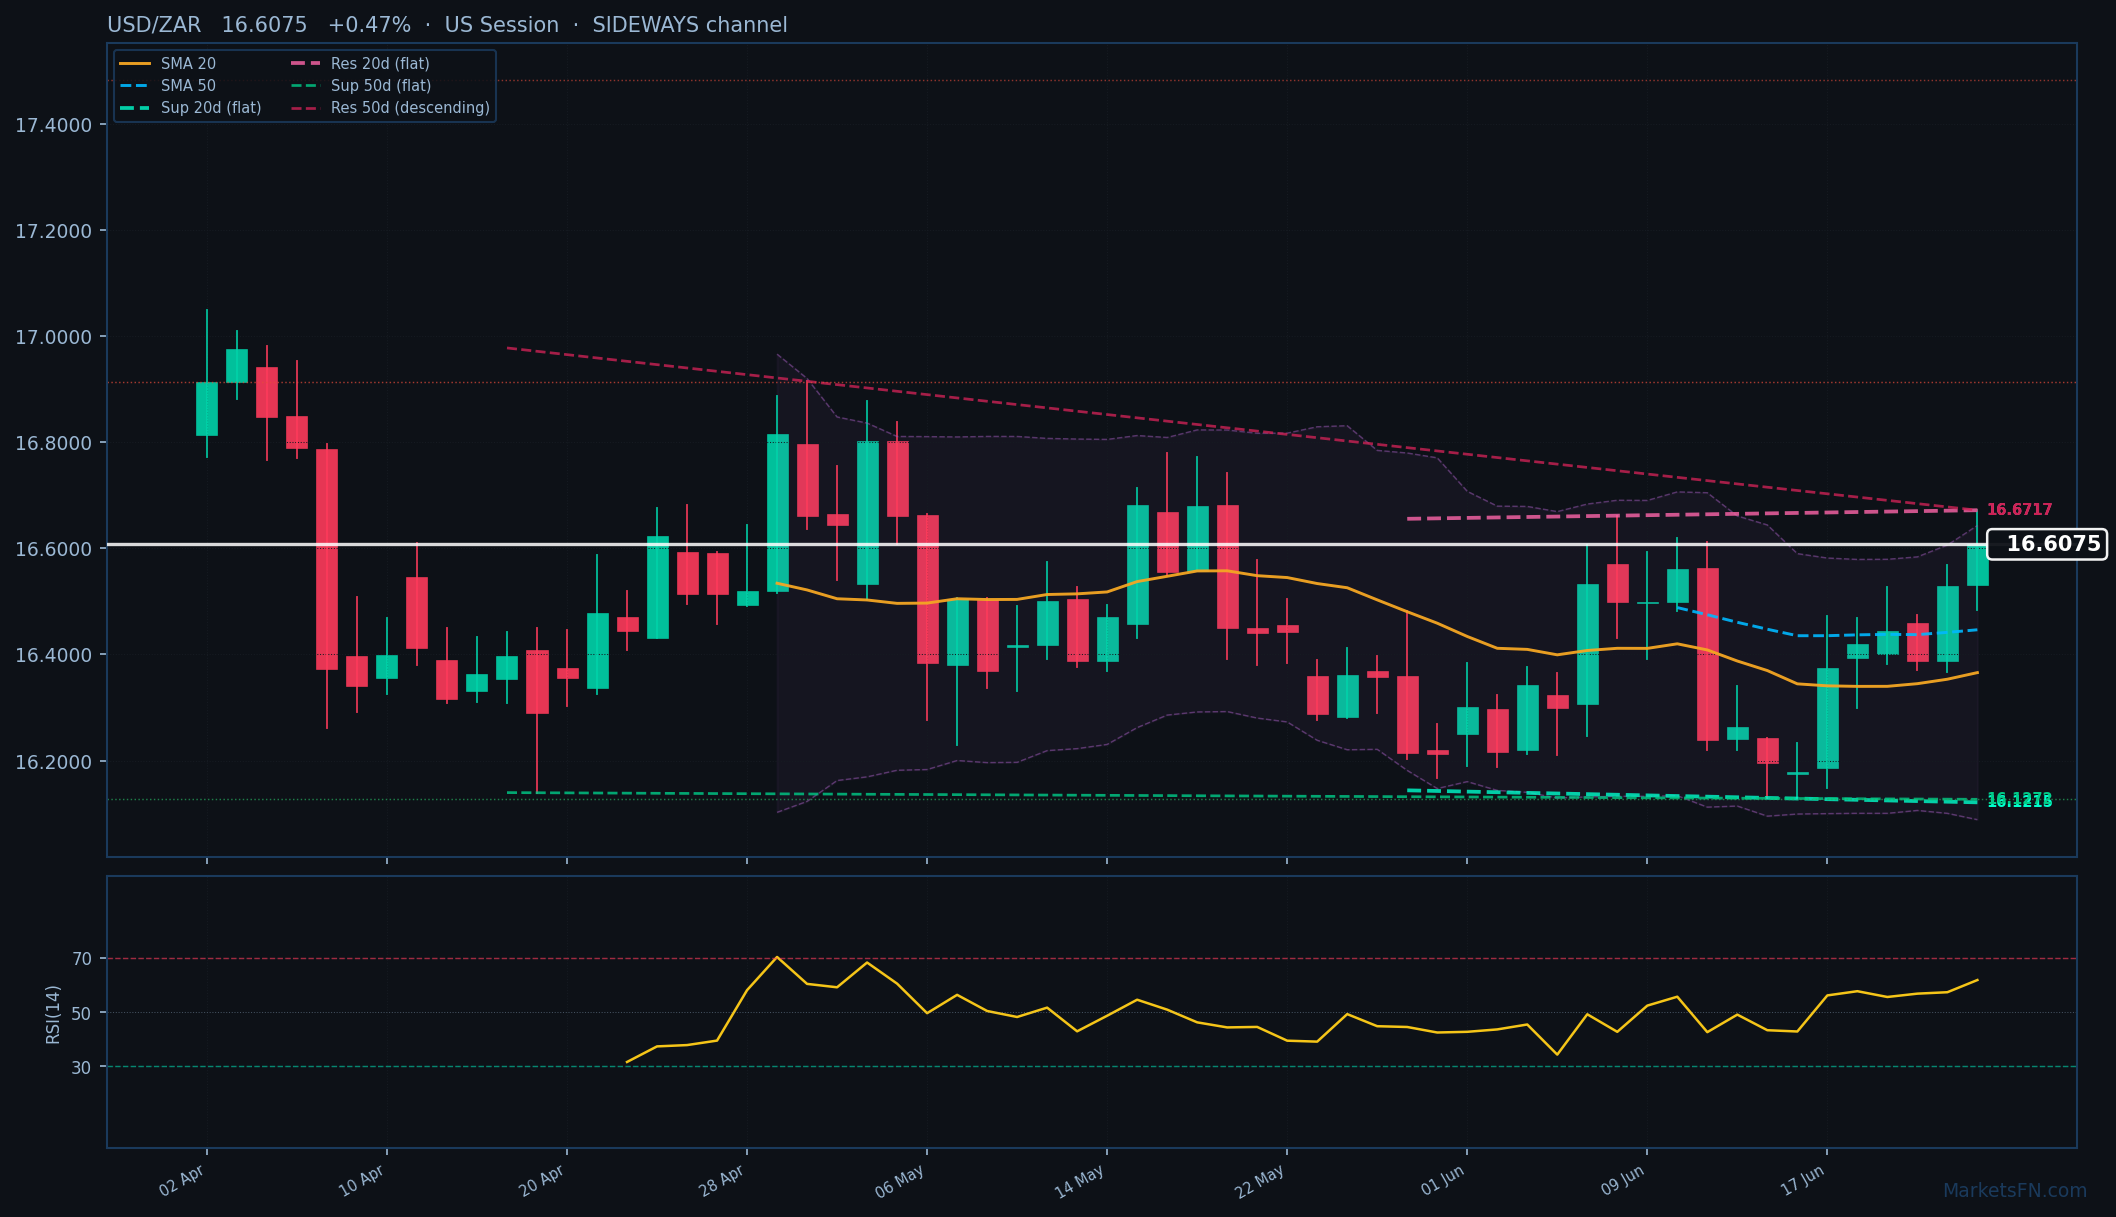
USD/ZAR: Up 0.47% to 16.6075 — Bullish — Above Key MAs
Published: June 24, 2026 · MarketsFN Team · US Session · Emerging FX
| Pair | Rate | Change | RSI(14) | SMA-20 | SMA-50 | 52W High | 52W Low | Pivot | R1 | S1 |
|---|---|---|---|---|---|---|---|---|---|---|
| USD/ZAR | 16.6075 | +0.47% | 61.8 | 16.3658 | 16.4465 | 18.1916 | 15.7197 | 16.4883 | 16.6094 | 16.4082 |
S/R Support & Resistance Levels
Dynamic Trendlines
| Level | Type | Direction | Distance |
|---|---|---|---|
| 16.1215 | 20d Support | flat (flat) | -2.93% / 4860.1 pips |
| 16.6717 | 20d Resistance | flat (flat) | +0.39% / 641.8 pips |
| 16.1272 | 50d Support | flat (flat) | -2.89% / 4802.9 pips |
| 16.6717 | 50d Resistance | down (descending) | +0.39% / 642.1 pips |
Static Levels
| Level | Type | Touches | Distance |
|---|---|---|---|
| 17.4820 | Resistance | 2x | +5.27% / 8747.7 pips |
| 16.9140 | Resistance | 2x | +1.85% / 3067.4 pips |
| 16.1285 | Support | 2x | -2.88% / 4788.1 pips |
USD/ZAR is trading at 16.6075 (+0.47%), testing the upper bounds of its recent range as bullish momentum builds. The pair sits above both its 20-day SMA (16.3658) and 50-day SMA (16.4465), confirming an uptrend, though the 20-day channel remains technically sideways with a flat slope. Immediate dynamic resistance looms at 16.6717, just 641.8 pips above current levels, while dynamic support rests at 16.1215, a steep 4860.1 pips below — highlighting asymmetric risk skewed toward downside potential if momentum reverses.
Static levels show clearer boundaries: R1 at 16.9140 (3067.4 pips away) marks the nearest overhead resistance, while S1 at 16.1285 (4788.1 pips below) serves as critical support. The RSI at 61.8 suggests neutral momentum, neither overbought nor oversold, leaving room for further upside before exhaustion. However, the 50-day dynamic resistance trendline is descending, hinting at potential bearish divergence if the pair fails to break higher.
Short-term outlook favors cautious bullishness, but traders should watch for rejection at 16.6717 dynamic resistance — a break above could target R1 at 16.9140, while failure may see a retest of the 20-day SMA at 16.3658. The European session’s price action near the day’s high (16.6718) suggests buyers are in control for now, though the wide ATR (0.2009) warns of volatility. Confirmation would come with a daily close above 16.6717; invalidation below 16.4082 (S1 pivot).
Disclaimer
The content on MarketsFN.com is provided for educational and informational purposes only and does not constitute financial advice. All investments involve risk and past performance does not guarantee future results.


