NZD/USD: Up 0.08% to 0.5607 — RSI Oversold
MarketsFN Team

NZD/USD: Up 0.08% to 0.5607 — RSI Oversold
Published: October 02, 2026 · MarketsFN Team · US Session
| Pair | Rate | Change | RSI(14) | SMA-20 | SMA-50 | 52W High | 52W Low | Pivot | R1 | S1 |
|---|---|---|---|---|---|---|---|---|---|---|
| NZD/USD | 0.5607 | +0.08% | 21.4 | 0.5722 | 0.5821 | 0.6075 | 0.5581 | 0.5610 | 0.5628 | 0.5584 |
📊 Support & Resistance Levels
Dynamic Trendlines
| Level | Type | Direction | Distance |
|---|---|---|---|
| 0.5571 | 20d Support | ↘ descending | -0.64% / 35.9 pips |
| 0.5642 | 20d Resistance | ↘ descending | +0.63% / 35.1 pips |
| 0.5585 | 50d Support | ↘ descending | -0.39% / 22.0 pips |
| 0.5814 | 50d Resistance | ↘ descending | +3.68% / 206.4 pips |
Static Levels
| Level | Type | Touches | Distance |
|---|---|---|---|
| 0.5994 | Resistance | 2× | +6.59% / 370.8 pips |
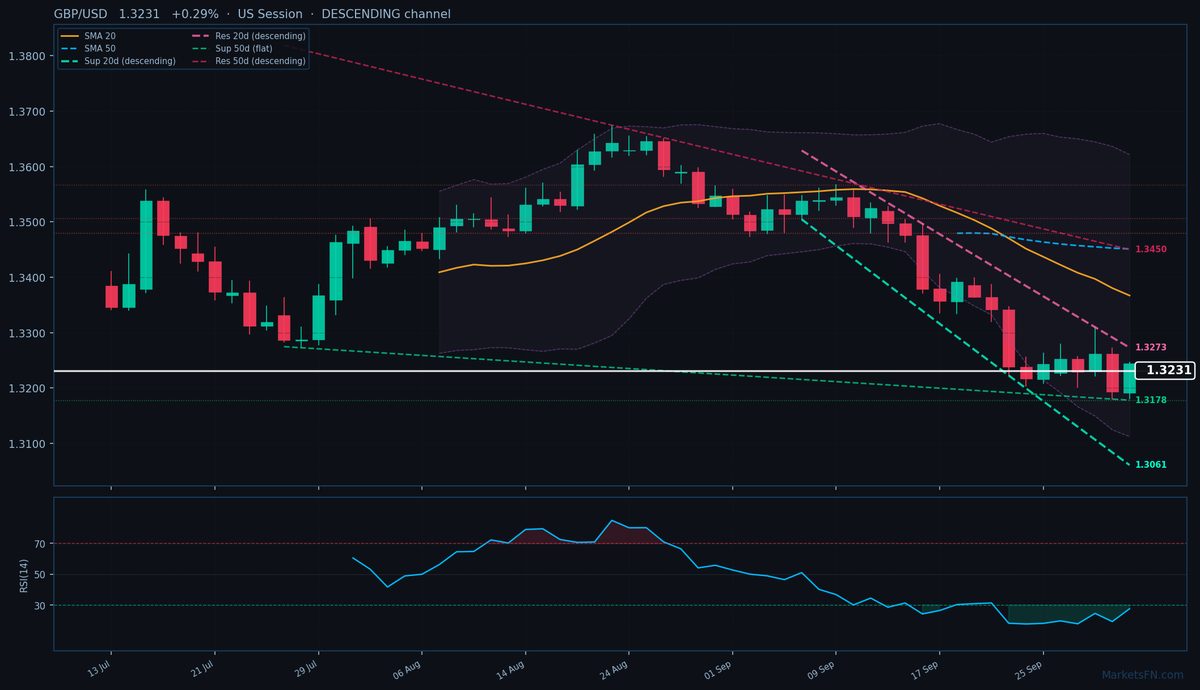
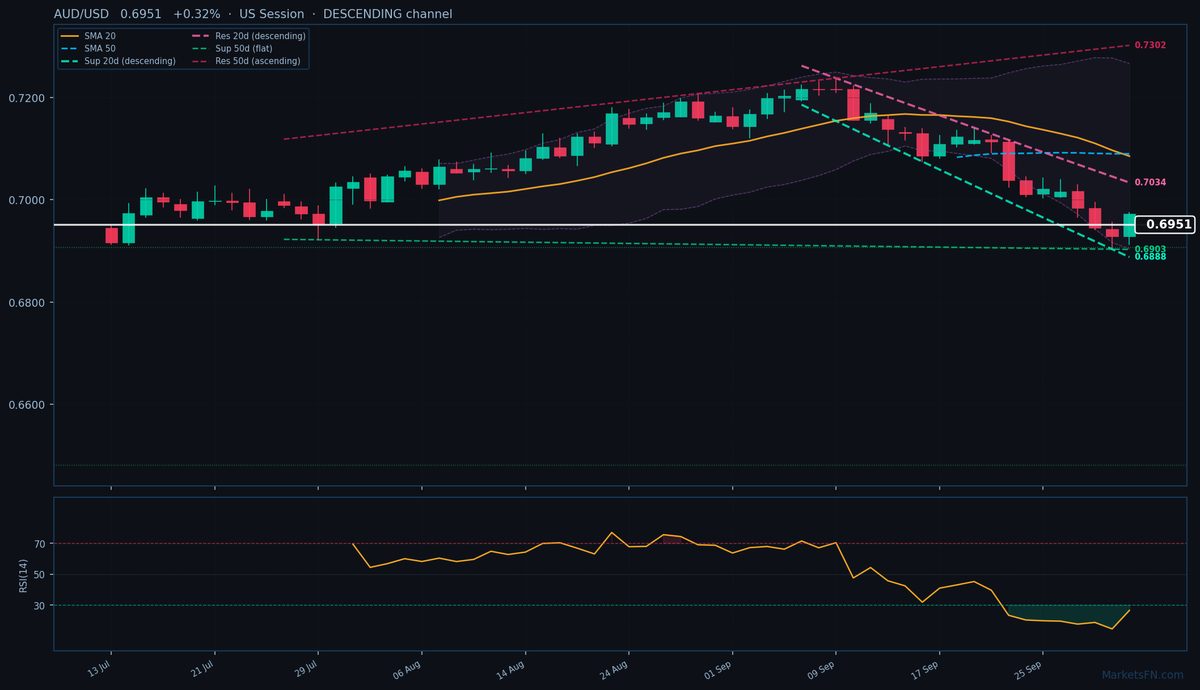
NZD/USD is trading at 0.5607 (+0.08%), clinging to the lower bounds of a firmly entrenched downtrend as the pair tests critical technical thresholds. The rate remains well below both the SMA-20 (0.5722) and SMA-50 (0.5821), confirming bearish momentum, while today’s intraday bounce from 0.5585 — just 4 pips above the 52-week low of 0.5581 — underscores fragile sentiment. The 20-day descending channel (slope -0.92%) shows immediate resistance at 0.5642 (+35.1 pips), while dynamic support sits at 0.5571 (-35.9 pips). The broader 50-day descending channel (slope -0.67%) highlights a steeper resistance ceiling at 0.5814 (+206.4 pips), suggesting any rallies face layered selling pressure. Static levels reinforce this: S1 at 0.5584 (-23 pips) marks near-term support, while R1 at 0.5628 (+21 pips) is the first hurdle for bulls. The RSI(14) at 21.4 signals extreme oversold conditions, raising risks of a technical rebound, but the descending ATR(14) of 0.0044 reflects fading volatility — a hallmark of bearish exhaustion. With the pair trapped between dynamic and static supports, a break below 0.5581 (52-week low) could accelerate losses toward the 0.5500 psychological level. Conversely, a close above the 20-day resistance trendline (0.5642) may trigger short-covering toward 0.5722 (SMA-20). Watch today’s US session close relative to S1 (0.5584) for confirmation of either scenario.
Disclaimer
The content on MarketsFN.com is provided for educational and informational purposes only and does not constitute financial advice. All investments involve risk and past performance does not guarantee future results.