USD/TRY: Up 0.38% to 46.4430 — RSI Overbought
MarketsFN Team
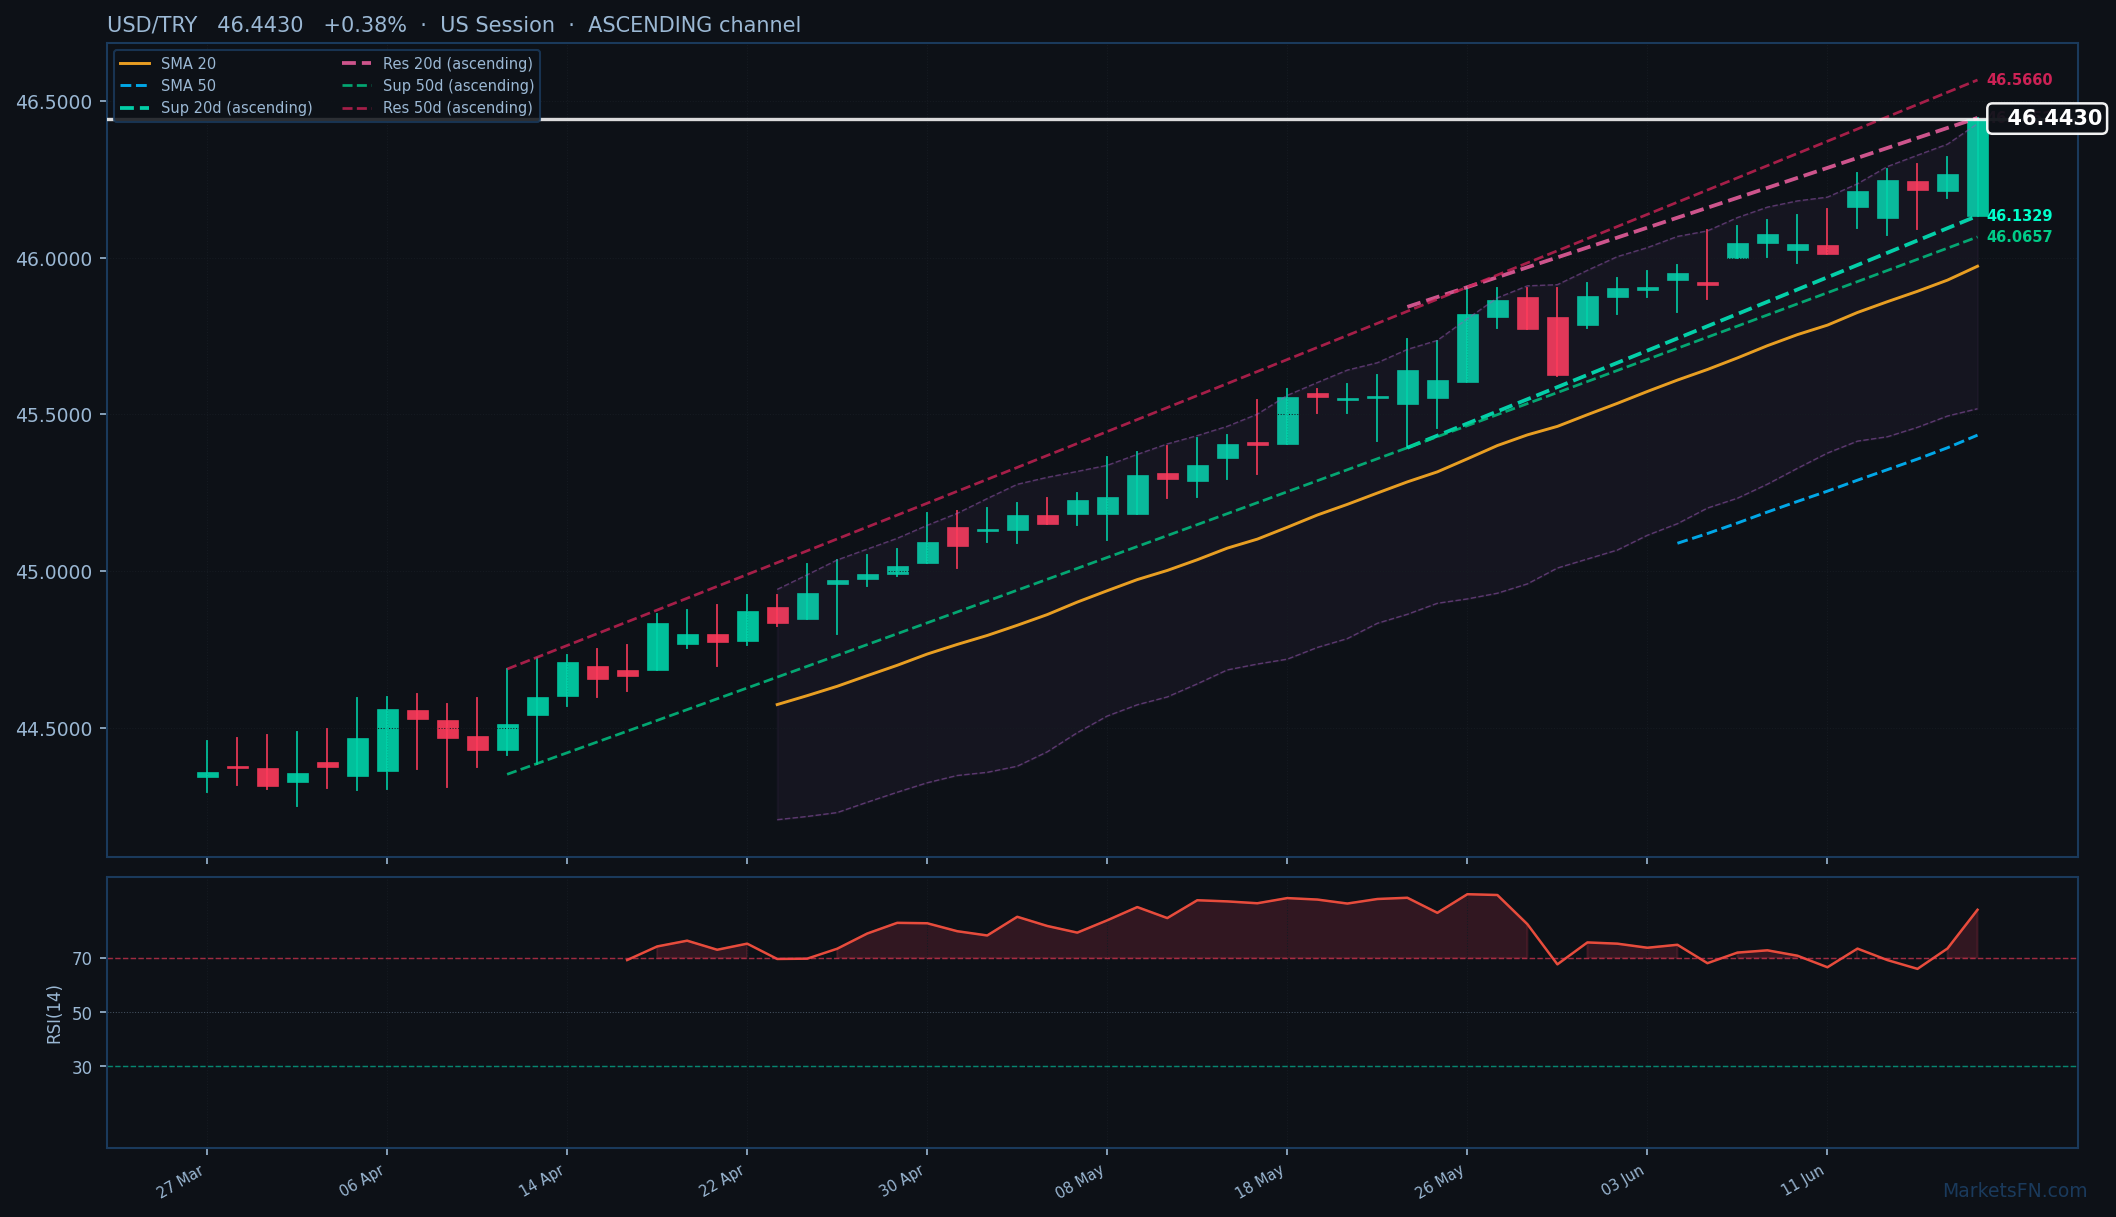
USD/TRY: Up 0.38% to 46.4430 — RSI Overbought
Published: June 18, 2026 · MarketsFN Team · US Session · Emerging FX
| Pair | Rate | Change | RSI(14) | SMA-20 | SMA-50 | 52W High | 52W Low | Pivot | R1 | S1 |
|---|---|---|---|---|---|---|---|---|---|---|
| USD/TRY | 46.4430 | +0.38% | 87.7 | 45.9725 | 45.4341 | 46.4430 | 39.6082 | 46.2586 | 46.3259 | 46.1982 |
S/R Support & Resistance Levels
Dynamic Trendlines
| Level | Type | Direction | Distance |
|---|---|---|---|
| 46.1329 | 20d Support | up (ascending) | -0.67% / 3101.7 pips |
| 46.4452 | 20d Resistance | up (ascending) | +0.00% / 21.3 pips |
| 46.0657 | 50d Support | up (ascending) | -0.81% / 3772.9 pips |
| 46.5660 | 50d Resistance | up (ascending) | +0.26% / 1229.6 pips |
USD/TRY is trading at 46.4430 (+0.38%), pushing further into record high territory as the lira’s structural vulnerabilities remain exposed. The pair is trading above both its 20-day SMA (45.9725) and 50-day SMA (45.4341), confirming the uptrend’s strength. Price action sits just 21.3 pips below the 20-day dynamic resistance trendline at 46.4452, with the ascending channel suggesting continued bullish momentum. The 50-day dynamic resistance looms at 46.5660 (+0.26%, 1229.6 pips away), while immediate static support rests at S1 (46.1982, -244.8 pips) and resistance at R1 (46.3259, -117.1 pips).
The RSI(14) at 87.7 signals extreme overbought conditions, raising the risk of a short-term pullback. However, the lira’s fundamental weakness — driven by Turkey’s persistent inflation and unorthodox monetary policy — may override technical warnings. The ATR(14) of 0.1839 reflects elevated volatility, typical for TRY pairs.
Short-term, the pair’s ability to hold above the 20-day dynamic support (46.1329, -3101.7 pips) will dictate whether this rally extends toward 46.5660. A break above 46.4452 could trigger momentum buying, while failure to sustain gains may see a retest of S1. The European session’s price action near the upper Bollinger Band (not provided) would offer additional confirmation. Watch for any intervention rhetoric from Turkish officials — the only near-term catalyst that could disrupt this technically and fundamentally driven ascent.
Disclaimer
The content on MarketsFN.com is provided for educational and informational purposes only and does not constitute financial advice. All investments involve risk and past performance does not guarantee future results.


