USD/THB: Up 1.02% to 33.5790 — Ascending Channel
MarketsFN Team
USD/THB: Up 1.02% to 33.5790 — Ascending Channel
Published: September 28, 2026 · MarketsFN Team · US Session · Emerging FX
| Pair | Rate | Change | RSI(14) | SMA-20 | SMA-50 | 52W High | 52W Low | Pivot | R1 | S1 |
|---|---|---|---|---|---|---|---|---|---|---|
| USD/THB | 33.5790 | +1.02% | 63.5 | 32.9393 | 33.1594 | 33.7470 | 30.5160 | 33.2143 | 33.3257 | 33.1177 |
S/R Support & Resistance Levels
Dynamic Trendlines
| Level | Type | Direction | Distance |
|---|---|---|---|
| 32.4993 | 20d Support | up (ascending) | -3.22% / 10797.1 pips |
| 33.5416 | 20d Resistance | up (ascending) | -0.11% / 374.0 pips |
| 31.9781 | 50d Support | down (descending) | -4.77% / 16008.9 pips |
| 33.3120 | 50d Resistance | down (descending) | -0.80% / 2670.0 pips |
Static Levels
| Level | Type | Touches | Distance |
|---|---|---|---|
| 32.4505 | Support | 2x | -2.38% / 7895.0 pips |
| 32.2535 | Support | 2x | -2.97% / 9865.0 pips |
| 32.1695 | Support | 2x | -3.22% / 10705.0 pips |
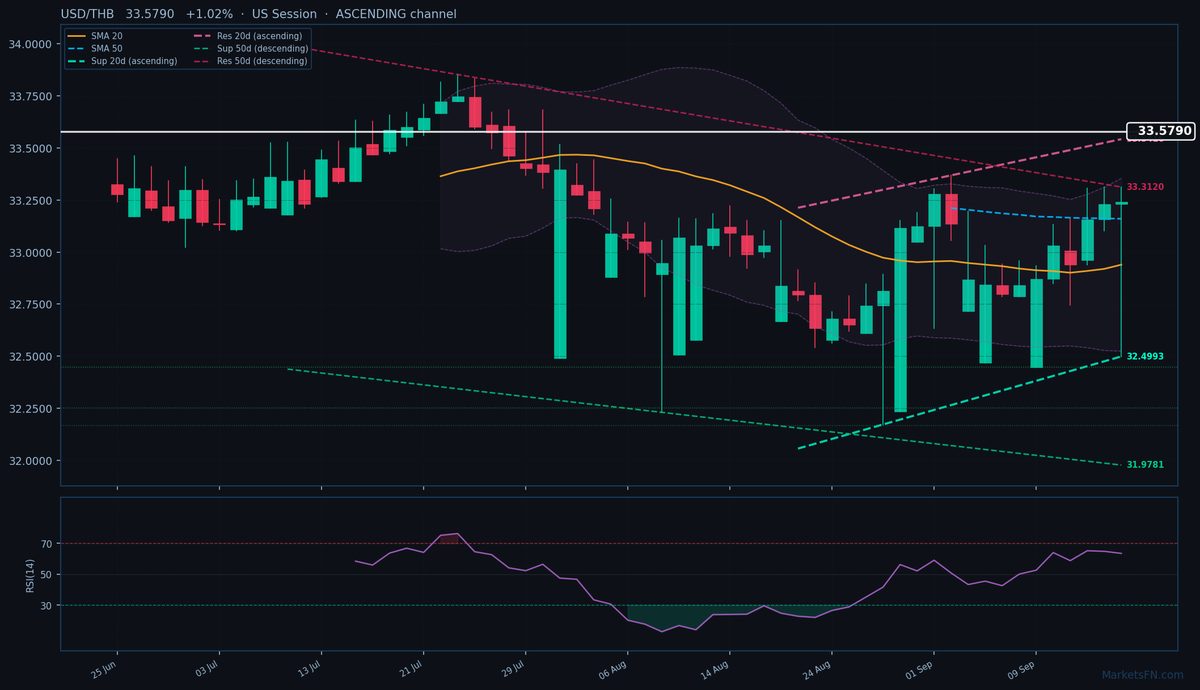
USD/THB is trading at 33.5790 (+1.02%), breaking decisively above both the 20-day (32.9393) and 50-day (33.1594) SMAs, confirming a bullish near-term bias. The pair is now just 374.0 pips from the ascending 20-day dynamic resistance trendline at 33.5416, while the 20-day dynamic support sits at 32.4993 (-2.23%, 10,797.1 pips away). This ascending channel suggests persistent buying pressure, though the conflicting 50-day descending channel (resistance at 33.3120, +0.22%, 2,670.0 pips away) warns of longer-term bearish divergence.
Static support S1 at 32.4505 (7,895.0 pips below) remains untested today, while R1 at 33.3257 is only 2,533.0 pips above — a plausible near-term target given today’s momentum. RSI at 63.5 shows room for further upside before overbought territory, but the +1.02% surge today (ATR 0.4274) suggests caution as volatility expands.
The immediate risk is a rejection at the 20-day dynamic resistance (33.5416), which could trigger profit-taking toward the 50-day SMA (33.1594). However, a daily close above 33.6000 would invalidate the 50-day descending channel and signal a broader trend reversal. Watch for a test of the 52-week high at 33.7470 (+0.50%, 1,680.0 pips away) if bullish momentum persists into the US session. A failure to hold above 33.3257 (R1) would expose the pivot at 33.2143 as interim support.
Disclaimer
The content on MarketsFN.com is provided for educational and informational purposes only and does not constitute financial advice. All investments involve risk and past performance does not guarantee future results.