USD/THB: Up 0.25% to 33.4660 — Bullish — Above Key MAs
MarketsFN Team
USD/THB: Up 0.25% to 33.4660 — Bullish — Above Key MAs
Published: July 31, 2026 · MarketsFN Team · US Session · Emerging FX
| Pair | Rate | Change | RSI(14) | SMA-20 | SMA-50 | 52W High | 52W Low | Pivot | R1 | S1 |
|---|---|---|---|---|---|---|---|---|---|---|
| USD/THB | 33.4660 | +0.25% | 47.4 | 33.4658 | 33.0697 | 33.7470 | 30.5160 | 33.4567 | 33.6063 | 33.2323 |
S/R Support & Resistance Levels
Dynamic Trendlines
| Level | Type | Direction | Distance |
|---|---|---|---|
| 32.4900 | 20d Support | down (descending) | -2.92% / 9760.0 pips |
| 34.0330 | 20d Resistance | up (ascending) | +1.69% / 5669.8 pips |
| 32.4900 | 50d Support | up (ascending) | -2.92% / 9760.0 pips |
| 34.0729 | 50d Resistance | up (ascending) | +1.81% / 6069.2 pips |
Static Levels
| Level | Type | Touches | Distance |
|---|---|---|---|
| 32.2533 | Support | 3x | -3.42% / 11416.7 pips |
| 32.1345 | Support | 2x | -3.77% / 12605.0 pips |
| 31.8410 | Support | 2x | -4.65% / 15540.0 pips |
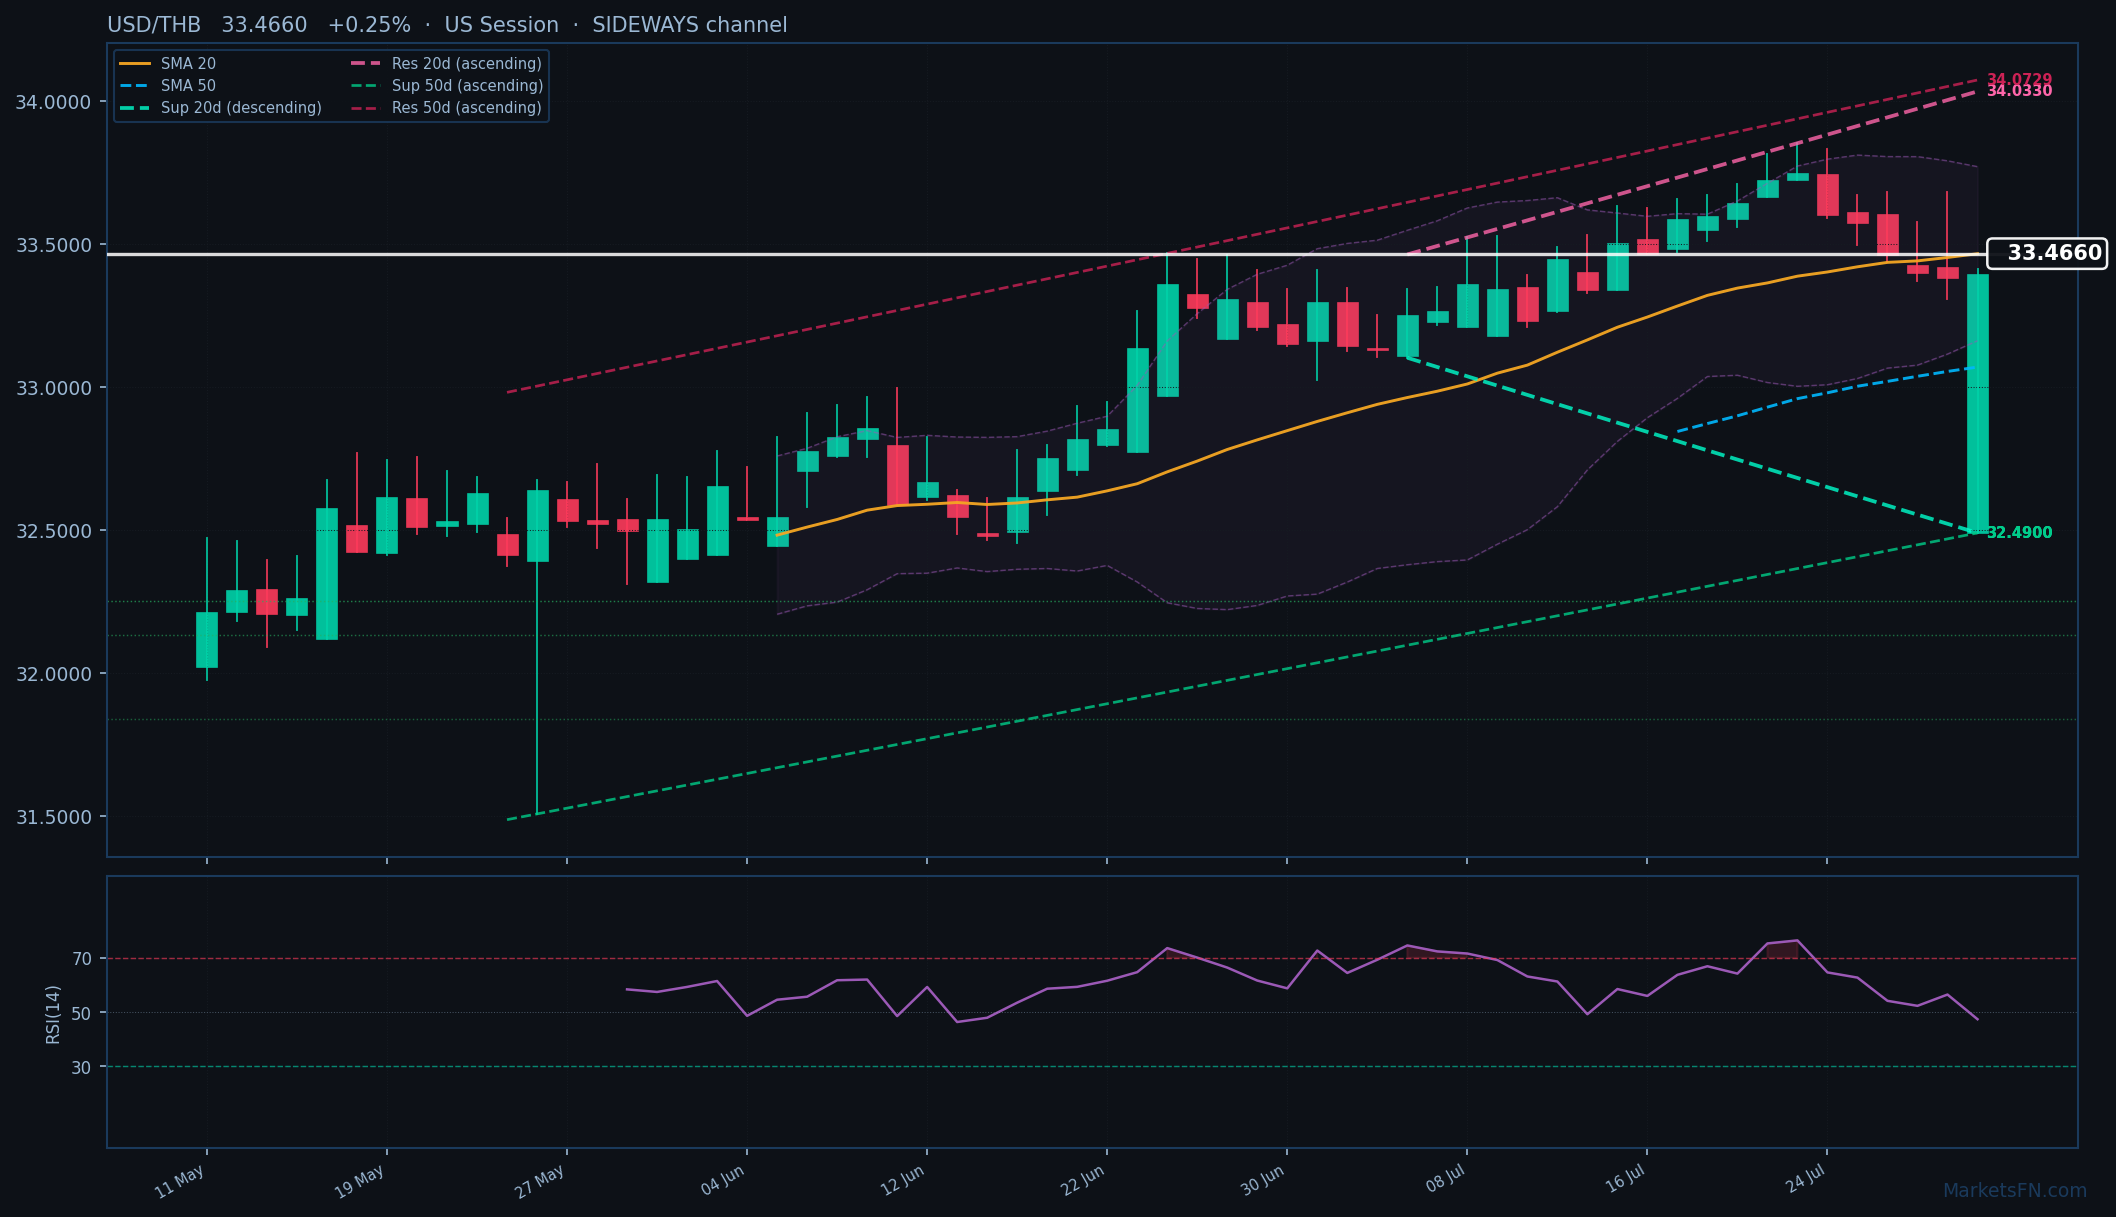
USD/THB is trading at 33.4660 (+0.25%) as it continues to show strength above both the 20-day simple moving average (SMA) of 33.4658 and the 50-day SMA of 33.0697, indicating an uptrend. The current price is positioned well within a sideways channel, with the 20-day dynamic resistance trendline at 34.0330, which is 5669.8 pips away, and the dynamic support trendline at 32.4900, 9760.0 pips below. This suggests that while the market is currently stable, there is potential for upward movement towards the resistance level.
Key static levels also play a crucial role in the analysis. The nearest resistance level, R1, is at 33.6063, which is 140.3 pips above the current price, while the closest support level, S1, is at 33.2323, 233.7 pips below. These levels will be critical in determining the short-term price action as traders look for signals of a breakout or reversal.
The RSI(14) is currently at 47.4, indicating neutral momentum, which suggests that the market is neither overbought nor oversold at this time. This neutral stance could lead to a consolidation phase before a potential breakout.
In the short term, the outlook remains cautiously optimistic, with the potential for upward movement towards the dynamic resistance level. A decisive break above R1 at 33.6063 could confirm bullish sentiment, while a drop below S1 at 33.2323 would raise concerns about a reversal.
Disclaimer
The content on MarketsFN.com is provided for educational and informational purposes only and does not constitute financial advice. All investments involve risk and past performance does not guarantee future results.


