USD/THB: Up 0.09% to 33.3900 — RSI Overbought
MarketsFN Team
USD/THB: Up 0.09% to 33.3900 — RSI Overbought
Published: July 09, 2026 · MarketsFN Team · US Session · Emerging FX
| Pair | Rate | Change | RSI(14) | SMA-20 | SMA-50 | 52W High | 52W Low | Pivot | R1 | S1 |
|---|---|---|---|---|---|---|---|---|---|---|
| USD/THB | 33.3900 | +0.09% | 70.8 | 33.0507 | 32.7091 | 33.3880 | 30.5160 | 33.3650 | 33.5190 | 33.2070 |
S/R Support & Resistance Levels
Dynamic Trendlines
| Level | Type | Direction | Distance |
|---|---|---|---|
| 33.1793 | 20d Support | up (ascending) | -0.63% / 2106.9 pips |
| 33.7973 | 20d Resistance | up (ascending) | +1.22% / 4072.9 pips |
| 33.0931 | 50d Support | up (ascending) | -0.89% / 2969.3 pips |
| 33.6676 | 50d Resistance | up (ascending) | +0.83% / 2776.0 pips |
Static Levels
| Level | Type | Touches | Distance |
|---|---|---|---|
| 32.2533 | Support | 3x | -3.40% / 11346.7 pips |
| 32.1345 | Support | 2x | -3.75% / 12535.0 pips |
| 31.8410 | Support | 2x | -4.63% / 15470.0 pips |
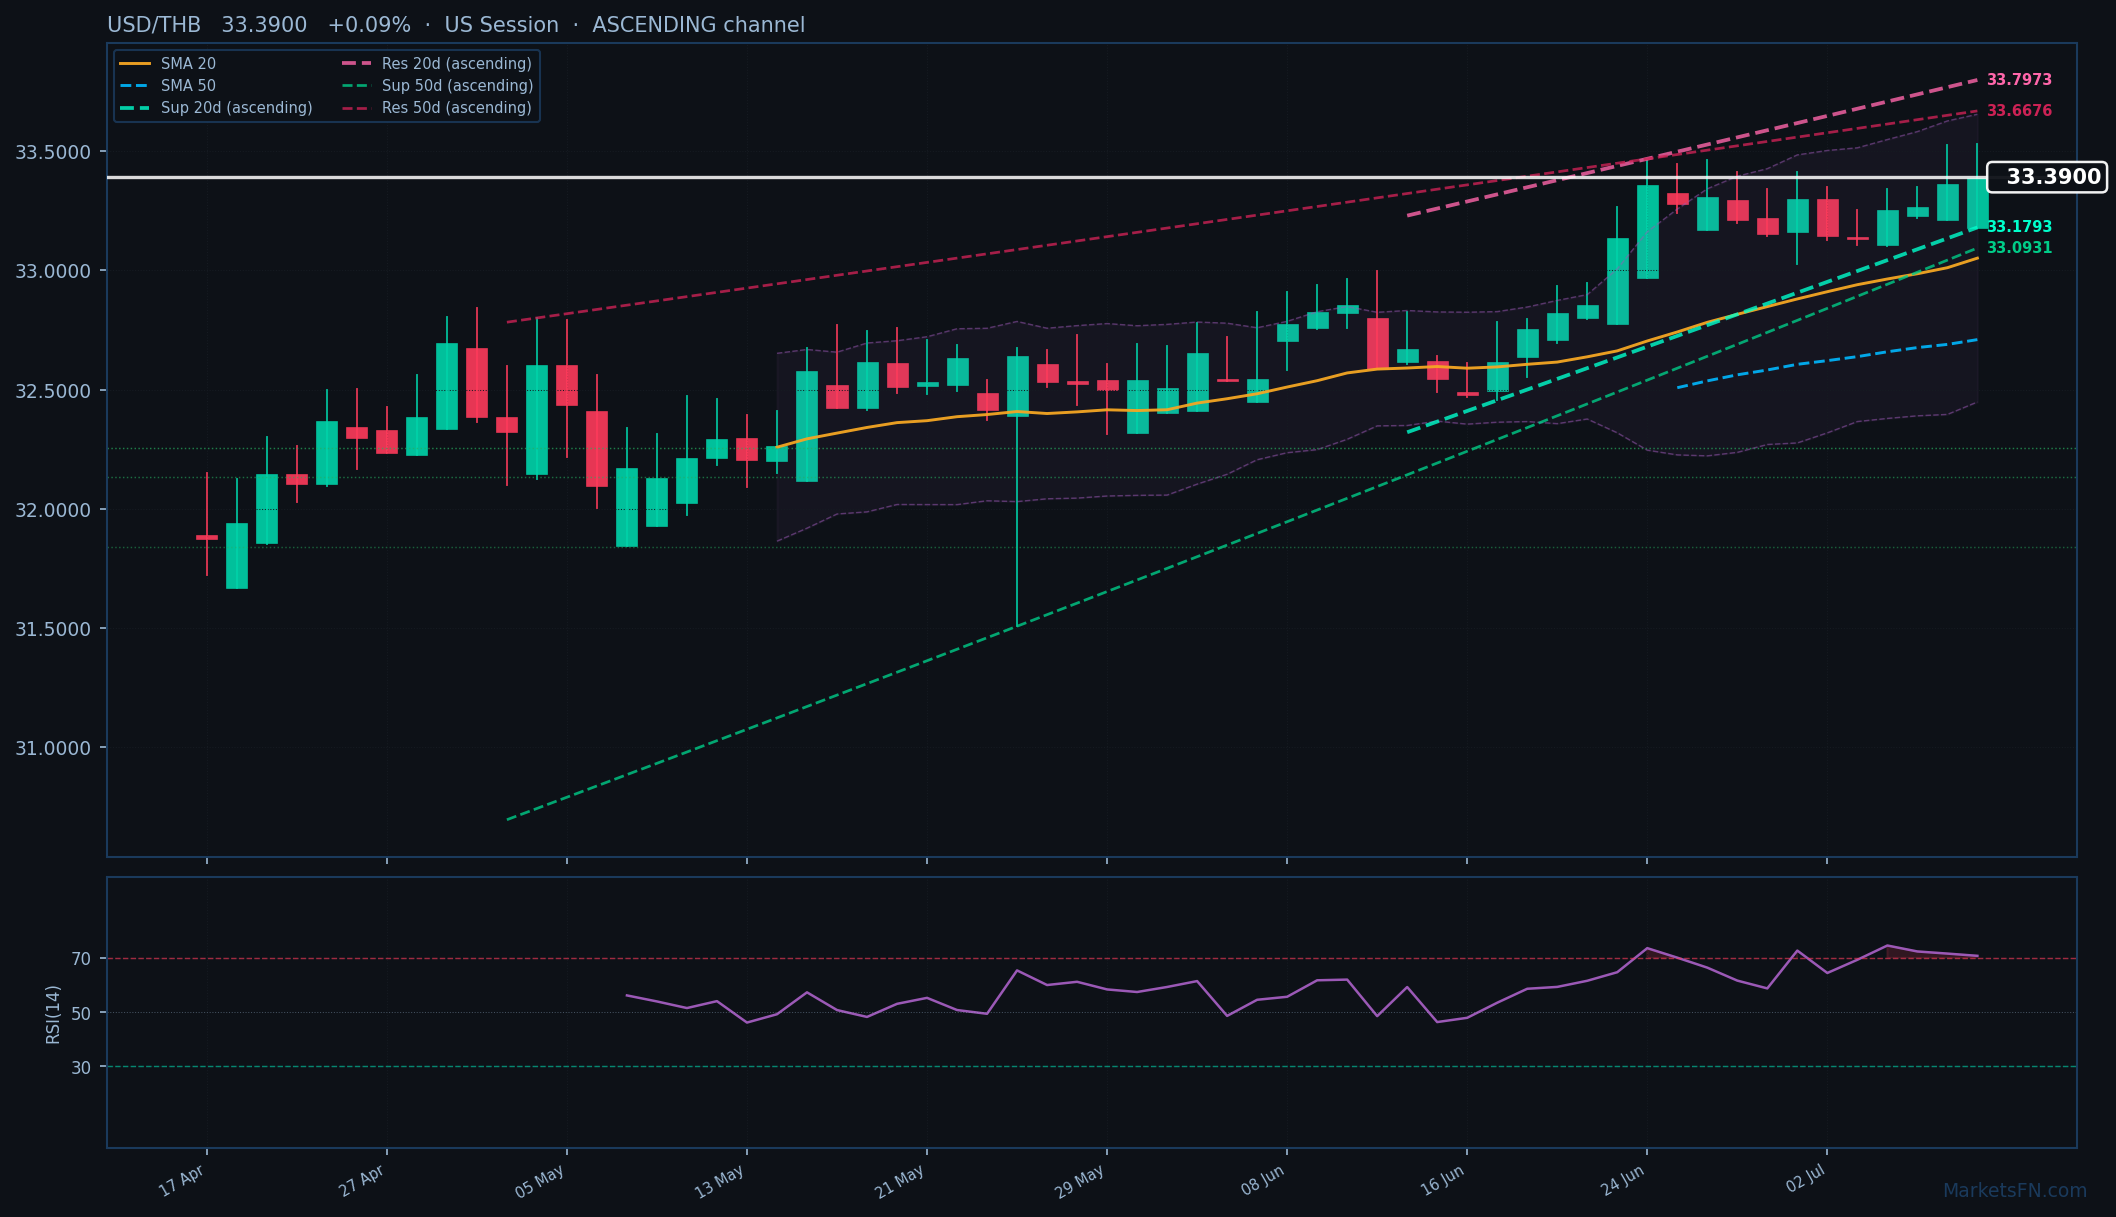
USD/THB is trading at 33.3900 (+0.09%), pressing against its 52-week high of 33.3880 in a clear uptrend, with the rate now 1.03% above the SMA-20 (33.0507) and 2.08% above the SMA-50 (32.7091). The pair is trading within an ascending 20-day dynamic channel, with immediate dynamic support at 33.1793 (2107 pips below) and resistance at 33.7973 (4073 pips above). The 50-day channel confirms the broader uptrend, with dynamic support at 33.0931 (2969 pips below) and resistance at 33.6676 (2776 pips above). Static levels show S1 at 33.2070 (1830 pips below) and R1 at 33.5190 (1290 pips above), with the latter acting as today’s intraday high.
The RSI(14) at 70.8 signals overbought conditions, suggesting potential near-term consolidation or pullback, though the ascending channel structure and price holding above key SMAs reinforce bullish momentum. Today’s range (33.1790–33.5270) has already tested the dynamic support trendline, with the pivot at 33.3650 serving as a intraday reference. A break above R1 (33.5190) could target the 52-week high, while failure to hold above the pivot may see a retest of dynamic support near 33.1793.
Short-term, the pair’s ability to sustain above the SMA-20 and pivot will dictate whether the overbought RSI triggers profit-taking or if momentum extends toward the dynamic resistance at 33.7973. Watch for a close above 33.5270 (today’s high) to confirm continuation, or a drop below 33.2070 (S1) to signal a deeper correction. The European session’s price action relative to the pivot will be key.
Disclaimer
The content on MarketsFN.com is provided for educational and informational purposes only and does not constitute financial advice. All investments involve risk and past performance does not guarantee future results.


