USD/SGD: Up 0.45% to 1.2722 — Descending Channel
MarketsFN Team
USD/SGD: Up 0.45% to 1.2722 — Descending Channel
Published: September 14, 2026 · MarketsFN Team · US Session · Emerging FX
| Pair | Rate | Change | RSI(14) | SMA-20 | SMA-50 | 52W High | 52W Low | Pivot | R1 | S1 |
|---|---|---|---|---|---|---|---|---|---|---|
| USD/SGD | 1.2722 | +0.45% | 43.9 | 1.2696 | 1.2798 | 1.3075 | 1.2595 | 1.2664 | 1.2694 | 1.2645 |
S/R Support & Resistance Levels
Dynamic Trendlines
| Level | Type | Direction | Distance |
|---|---|---|---|
| 1.2620 | 20d Support | down (descending) | -0.80% / 101.5 pips |
| 1.2708 | 20d Resistance | down (descending) | -0.10% / 13.3 pips |
| 1.2584 | 50d Support | down (descending) | -1.08% / 138.0 pips |
| 1.2692 | 50d Resistance | down (descending) | -0.23% / 29.6 pips |
Static Levels
| Level | Type | Touches | Distance |
|---|---|---|---|
| 1.2936 | Resistance | 2x | +2.15% / 271.6 pips |
| 1.2899 | Resistance | 2x | +1.85% / 234.8 pips |
| 1.2840 | Resistance | 2x | +1.39% / 176.1 pips |
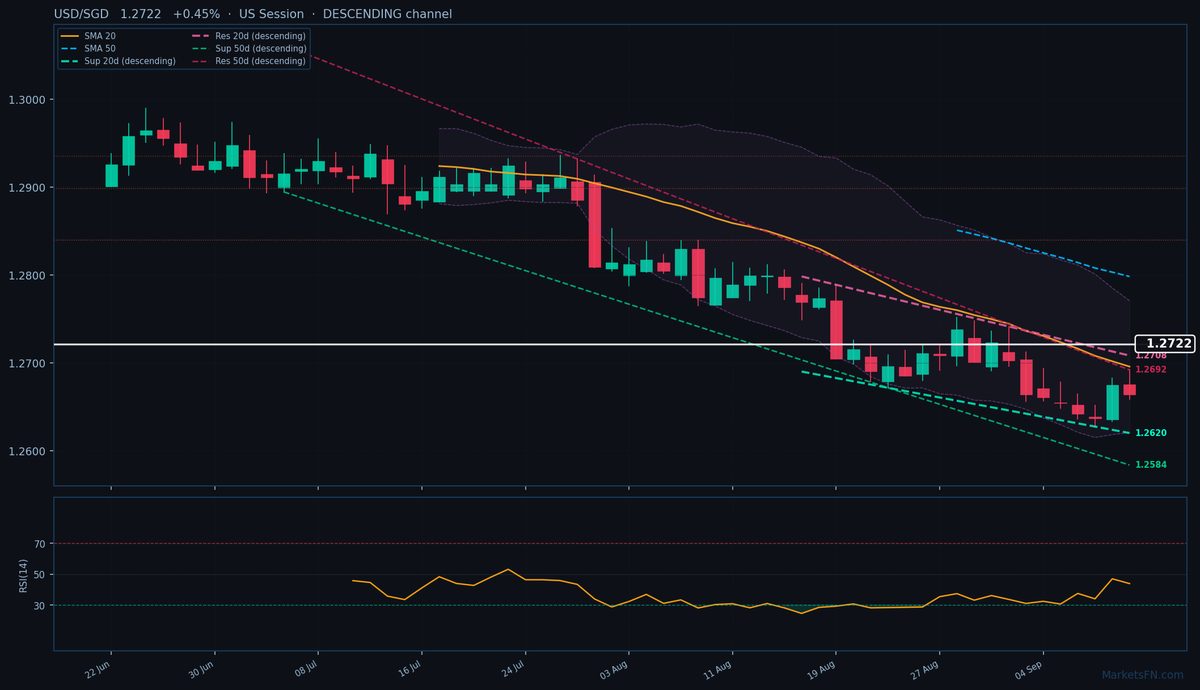
USD/SGD is trading at 1.2722 (+0.45%), breaking above the 20-day SMA (1.2696) but still capped by the 50-day SMA (1.2798), signaling a tentative consolidation phase within a broader descending channel. The pair is testing the upper boundary of its 20-day dynamic resistance trendline at 1.2708 (just 13.3 pips above), while the descending 20-day support trendline sits at 1.2620 (101.5 pips below). The 50-day dynamic resistance is marginally higher at 1.2692 (29.6 pips away), reinforcing the downtrend’s persistence. Static levels show immediate support at S1 (1.2645, 77 pips below) and resistance at R1 (1.2694, 17 pips above), though more significant static resistance looms at 1.2840 (176.1 pips away).
RSI at 43.9 remains neutral, lacking conviction for either a breakout or reversal. The pair’s +0.45% gain today is notable but still within the 14-day ATR of 0.0039, suggesting this isn’t a decisive shift. The descending channels across both 20- and 50-day timeframes underscore bearish pressure, though a sustained hold above the 20-day SMA could signal short-term stabilization.
Short-term, watch for rejection at the 20-day dynamic resistance (1.2708) or a break toward the 50-day SMA (1.2798). A failure to hold above 1.2696 (20-day SMA) would likely retest S1 (1.2645). The European session’s price action will be critical—any close above 1.2708 could delay the downtrend, while a reversal would reaffirm the bearish channel.
Disclaimer
The content on MarketsFN.com is provided for educational and informational purposes only and does not constitute financial advice. All investments involve risk and past performance does not guarantee future results.