USD/SGD: Up 0.01% to 1.2778 — Price Below SMA-20
MarketsFN Team
USD/SGD: Up 0.01% to 1.2778 — Price Below SMA-20
Published: October 22, 2026 · MarketsFN Team · US Session · Emerging FX
| Pair | Rate | Change | RSI(14) | SMA-20 | SMA-50 | 52W High | 52W Low | Pivot | R1 | S1 |
|---|---|---|---|---|---|---|---|---|---|---|
| USD/SGD | 1.2778 | +0.01% | 45.5 | 1.2787 | 1.2745 | 1.3075 | 1.2595 | 1.2776 | 1.2790 | 1.2754 |
S/R Support & Resistance Levels
Dynamic Trendlines
| Level | Type | Direction | Distance |
|---|---|---|---|
| 1.2759 | 20d Support | flat (flat) | -0.15% / 18.9 pips |
| 1.2892 | 20d Resistance | up (ascending) | +0.89% / 113.6 pips |
| 1.2750 | 50d Support | up (ascending) | -0.22% / 28.1 pips |
| 1.2877 | 50d Resistance | flat (flat) | +0.77% / 98.5 pips |
Static Levels
| Level | Type | Touches | Distance |
|---|---|---|---|
| 1.2936 | Resistance | 2x | +1.25% / 159.1 pips |
| 1.2840 | Resistance | 2x | +0.50% / 63.6 pips |
| 1.2810 | Resistance | 2x | +0.26% / 33.1 pips |
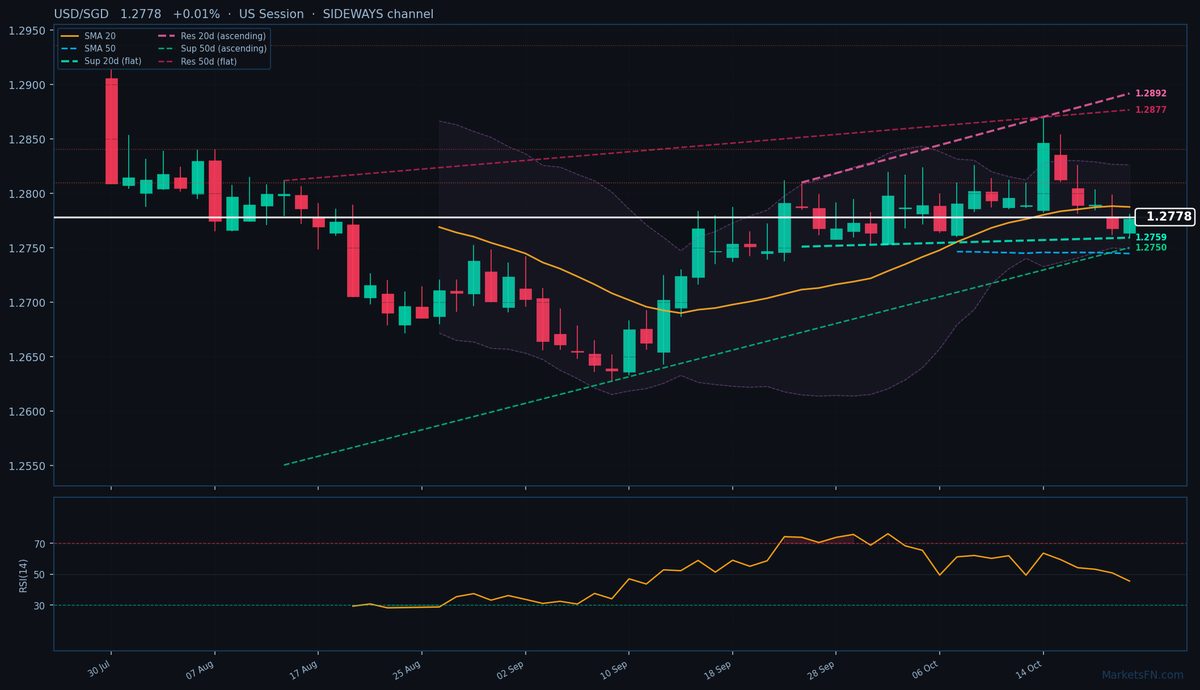
USD/SGD is trading at 1.2778 (+0.01%), trapped in a consolidation phase between its 20-day SMA (1.2787, 9 pips above) and 50-day SMA (1.2745, 33 pips below). The pair is grinding sideways within a 22-pip daily range (1.2759–1.2781), lacking conviction as it tests the pivot at 1.2776. The 20-day dynamic channel is flat, with immediate support at 1.2759 (18.9 pips below) and ascending resistance at 1.2892 (113.6 pips above). The broader 50-day channel remains ascending, with stronger support at 1.2750 (28.1 pips below) and flat resistance at 1.2877 (98.5 pips above).
Static levels show congestion, with S1 at 1.2754 (24.4 pips below) and R1 at 1.2790 (11.2 pips above). The RSI at 45.5 confirms neutral momentum, while the ATR of 0.0039 reflects subdued volatility. The market is hesitating ahead of the 1.2810 static resistance (33.1 pips away), which has capped rallies twice before.
Short-term, the bias leans neutral-to-bearish unless USD/SGD reclaims the 20-day SMA. A break below 1.2750 (50-day dynamic support) could trigger a test of the 1.2730–1.2745 zone, where the 50-day SMA and October lows converge. Upside requires clearing 1.2790 (R1) to challenge 1.2810. Watch for a close above 1.2787 (20-day SMA) to signal bullish momentum. The next catalyst is the US core PCE print on Friday — a hotter-than-expected reading could revive USD strength and test the 20-day dynamic resistance.
Disclaimer
The content on MarketsFN.com is provided for educational and informational purposes only and does not constitute financial advice. All investments involve risk and past performance does not guarantee future results.