USD/MXN: Up 1.17% to 17.1666 — Price Holds Above SMA-20
MarketsFN Team
USD/MXN: Up 1.17% to 17.1666 — Price Holds Above SMA-20
Published: September 14, 2026 · MarketsFN Team · US Session · Emerging FX
| Pair | Rate | Change | RSI(14) | SMA-20 | SMA-50 | 52W High | 52W Low | Pivot | R1 | S1 |
|---|---|---|---|---|---|---|---|---|---|---|
| USD/MXN | 17.1666 | +1.17% | 69.2 | 16.9641 | 17.1859 | 18.6856 | 16.8835 | 16.9669 | 17.0088 | 16.9260 |
S/R Support & Resistance Levels
Dynamic Trendlines
| Level | Type | Direction | Distance |
|---|---|---|---|
| 16.8454 | 20d Support | flat (flat) | -1.87% / 3211.7 pips |
| 17.1671 | 20d Resistance | up (ascending) | +0.00% / 5.0 pips |
| 16.6558 | 50d Support | down (descending) | -2.98% / 5108.3 pips |
| 17.1671 | 50d Resistance | down (descending) | +0.00% / 5.0 pips |
Static Levels
| Level | Type | Touches | Distance |
|---|---|---|---|
| 17.5648 | Resistance | 2x | +2.32% / 3981.3 pips |
| 17.5352 | Resistance | 2x | +2.15% / 3685.5 pips |
| 17.4358 | Resistance | 2x | +1.57% / 2691.5 pips |
| 17.1529 | Support | 2x | -0.08% / 137.5 pips |
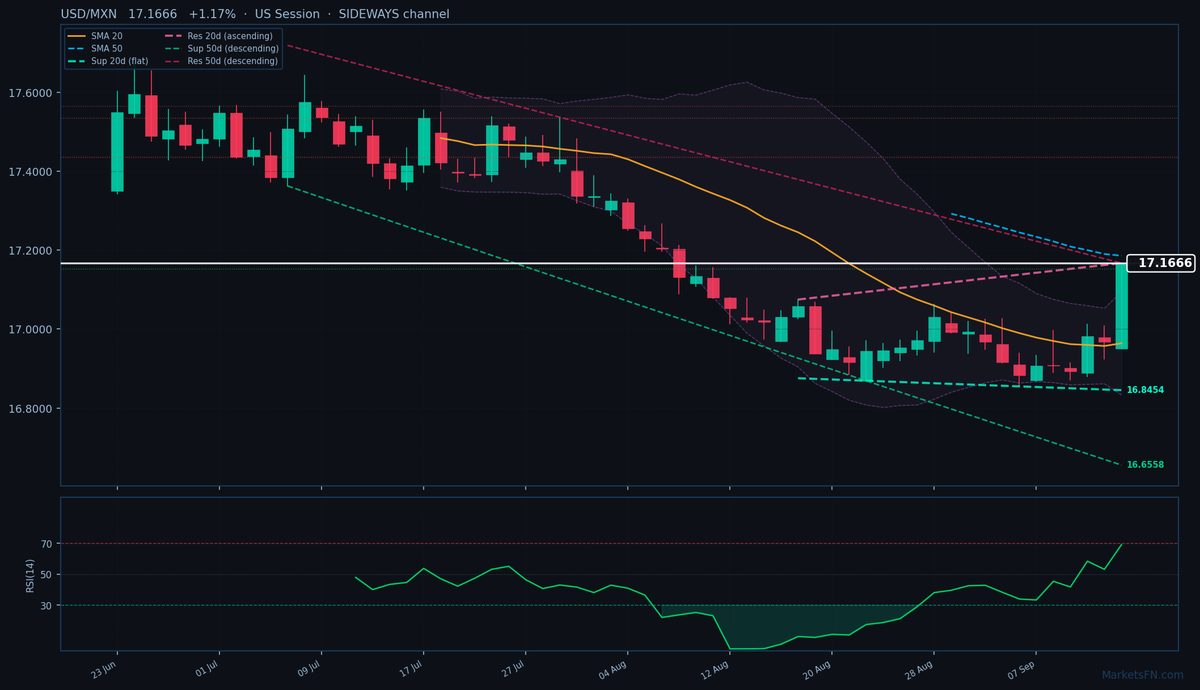
USD/MXN is trading at 17.1666 (+1.17%), testing a critical inflection point as it straddles key moving averages in a tightening consolidation phase. The pair is currently sandwiched between its SMA-20 (16.9641, +202.5 pips below) and SMA-50 (17.1859, -193.0 pips above), reflecting indecision after breaking above the 20-day average but failing to sustain momentum through the 50-day. The 20-day dynamic resistance trendline at 17.1671 (ascending, +0.00% from current, just 5.0 pips away) is being tested intraday, while the 50-day dynamic resistance sits at the same level (descending, +0.00%, 5.0 pips). This confluence creates a make-or-break technical zone — a close above 17.1671 could trigger a squeeze toward static resistance at R1 17.4358 (2691.5 pips away), while rejection here would expose S1 static support at 17.1529 (137.5 pips below) and the SMA-20.
RSI at 69.2 shows neutral momentum despite the day's rally, suggesting limited follow-through buying power. The 50-day descending channel (avg slope) dominates the medium-term trend, but today's breakout attempt could signal a shift if sustained. Watch for confirmation above 17.1671 with volume — failure here would reinforce the bearish channel structure and target the 20-day dynamic support at 16.8454 (3211.7 pips below). Near-term direction hinges on whether European session momentum can overcome the SMA-50/resistance confluence. ATR(14) at 0.0916 suggests today's range expansion may exhaust near current levels unless fresh catalysts emerge.
Disclaimer
The content on MarketsFN.com is provided for educational and informational purposes only and does not constitute financial advice. All investments involve risk and past performance does not guarantee future results.