USD/MXN: Up 0.98% to 17.8533 — RSI Overbought
MarketsFN Team
USD/MXN: Up 0.98% to 17.8533 — RSI Overbought
Published: September 28, 2026 · MarketsFN Team · US Session · Emerging FX
| Pair | Rate | Change | RSI(14) | SMA-20 | SMA-50 | 52W High | 52W Low | Pivot | R1 | S1 |
|---|---|---|---|---|---|---|---|---|---|---|
| USD/MXN | 17.8533 | +0.98% | 87.7 | 17.1798 | 17.1707 | 18.6856 | 16.8835 | 17.7005 | 17.7572 | 17.6241 |
S/R Support & Resistance Levels
Dynamic Trendlines
| Level | Type | Direction | Distance |
|---|---|---|---|
| 17.3530 | 20d Support | up (ascending) | -2.80% / 5002.7 pips |
| 17.8566 | 20d Resistance | up (ascending) | +0.02% / 33.0 pips |
| 16.8296 | 50d Support | flat (flat) | -5.73% / 10237.3 pips |
| 17.8535 | 50d Resistance | up (ascending) | +0.00% / 1.7 pips |
Static Levels
| Level | Type | Touches | Distance |
|---|---|---|---|
| 18.8632 | Resistance | 2x | +5.66% / 10098.9 pips |
| 18.0365 | Resistance | 2x | +1.03% / 1831.6 pips |
| 17.1529 | Support | 2x | -3.92% / 7004.4 pips |
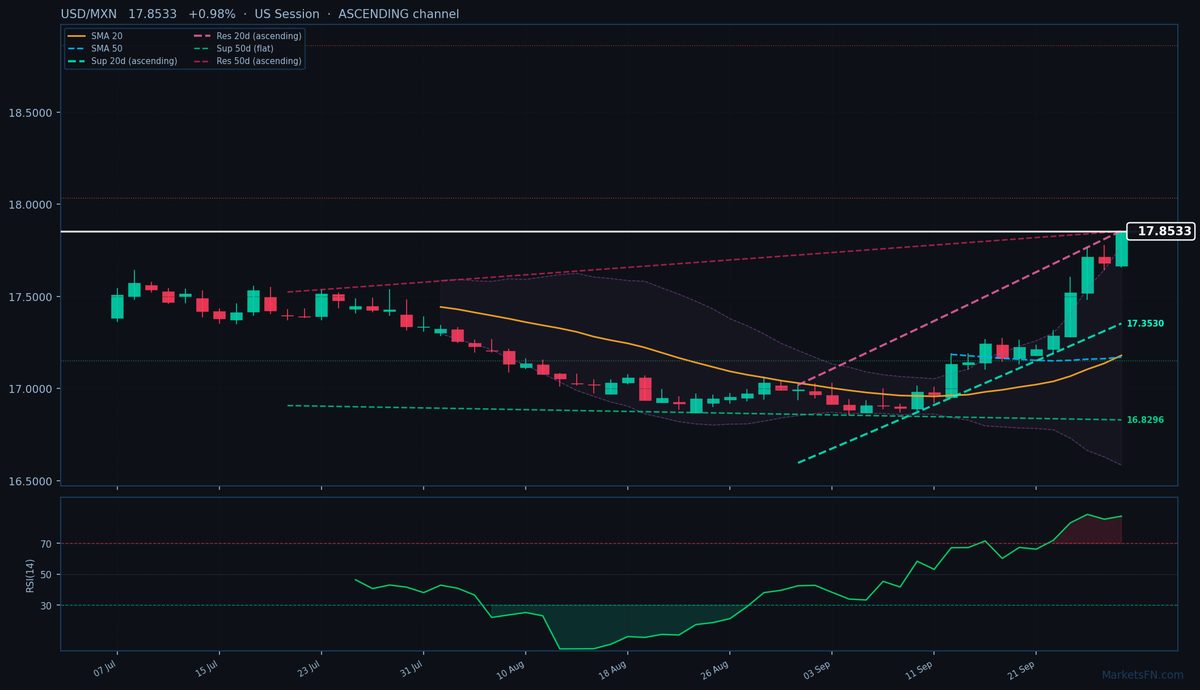
USD/MXN is trading at 17.8533 (+0.98%), pressing against critical resistance in an overbought rally that demands caution. The pair is firmly in an uptrend, trading above both the 20-day (17.1798) and 50-day (17.1707) SMAs, with the 20-day dynamic resistance trendline just 33 pips away at 17.8566. This ascending channel suggests persistent bullish momentum, though the RSI at 87.7 screams exhaustion — the highest reading in the 52-week range. The nearest dynamic support sits at 17.3530 (-2.80%, 5002 pips below), offering a steep fallback level if profit-taking emerges.
Static levels reveal a stark asymmetry: the closest resistance (R1 at 18.0365) is 1831 pips away, while support (S1 at 17.1529) lies 7004 pips below, highlighting the pair’s extended positioning. The 50-day channel has turned sideways, suggesting consolidation may follow this aggressive move. With the ATR at 0.1500, today’s range already matches the average volatility, leaving little room for further upside without a pullback.
Short-term, the pair is at an inflection point. A break above the 20-day dynamic resistance (17.8566) could target 18.0365, but the extreme RSI favors a retracement first. Watch for a close below today’s pivot (17.7005) to confirm profit-taking, with the 20-day SMA (17.1798) as a deeper pullback target. The European session’s price action will be decisive — either validating the overbought extension or triggering a overdue correction.
Disclaimer
The content on MarketsFN.com is provided for educational and informational purposes only and does not constitute financial advice. All investments involve risk and past performance does not guarantee future results.