USD/MXN: Up 0.45% to 18.6327 — RSI Overbought
MarketsFN Team
USD/MXN: Up 0.45% to 18.6327 — RSI Overbought
Published: October 27, 2026 · MarketsFN Team · US Session · Emerging FX
| Pair | Rate | Change | RSI(14) | SMA-20 | SMA-50 | 52W High | 52W Low | Pivot | R1 | S1 |
|---|---|---|---|---|---|---|---|---|---|---|
| USD/MXN | 18.6327 | +0.45% | 70.2 | 18.3556 | 17.6303 | 18.7100 | 16.8835 | 18.6100 | 18.6980 | 18.4621 |
S/R Support & Resistance Levels
Dynamic Trendlines
| Level | Type | Direction | Distance |
|---|---|---|---|
| 18.5290 | 20d Support | up (ascending) | -0.56% / 1037.6 pips |
| 18.9422 | 20d Resistance | up (ascending) | +1.66% / 3094.1 pips |
| 18.2509 | 50d Support | up (ascending) | -2.05% / 3818.0 pips |
| 19.2689 | 50d Resistance | up (ascending) | +3.41% / 6361.4 pips |
Static Levels
| Level | Type | Touches | Distance |
|---|---|---|---|
| 17.8683 | Support | 2x | -4.10% / 7639.2 pips |
| 17.1529 | Support | 2x | -7.94% / 14793.5 pips |
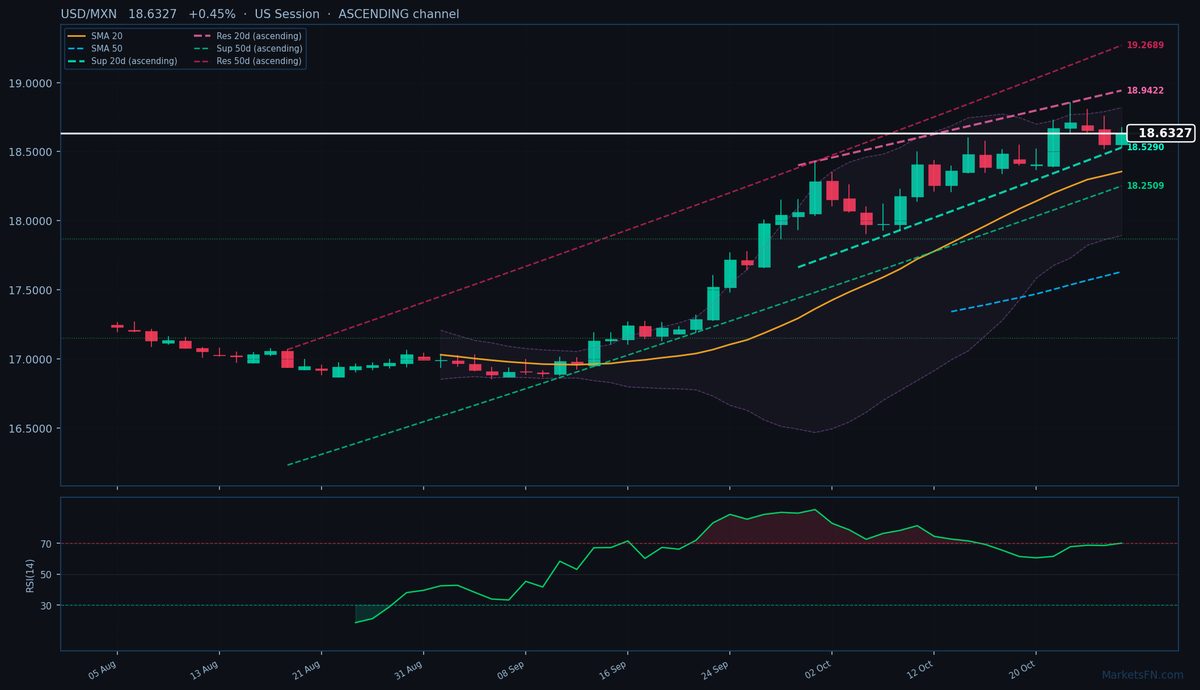
USD/MXN is trading at 18.6327 (+0.45%), extending its bullish momentum as it presses against the upper bounds of its 52-week range (16.8835–18.7100). The pair is firmly above both its SMA-20 (18.3556) and SMA-50 (17.6303), confirming the uptrend’s strength. Today’s high of 18.6756 brings it within 343 pips of the 52-week peak at 18.7100, a critical psychological barrier.
The 20-day dynamic channel is ascending, with immediate support at 18.5290 (-1037.6 pips) and resistance at 18.9422 (+3094.1 pips). The 50-day channel mirrors this structure, with support at 18.2509 (-3818.0 pips) and resistance at 19.2689 (+6361.4 pips). These widening channels suggest accelerating bullish momentum, though the RSI(14) at 70.2 signals overbought conditions, raising the risk of a near-term pullback.
Static levels show S1 at 18.4621 (-1706 pips) and R1 at 18.6980 (+653 pips), with today’s price action already testing the upper half of this range. The pivot at 18.6100 is acting as intraday support, but a break below could target S1.
Short-term, the pair’s trajectory hinges on whether it can breach the 52-week high at 18.7100. Failure here may trigger profit-taking given the overbought RSI, while a breakout could accelerate toward the 20-day dynamic resistance at 18.9422. Watch today’s close relative to 18.6100 for confirmation of near-term direction.
Disclaimer
The content on MarketsFN.com is provided for educational and informational purposes only and does not constitute financial advice. All investments involve risk and past performance does not guarantee future results.