USD/MXN: Up 0.28% to 17.3413 — Bullish — Above Key MAs
MarketsFN Team
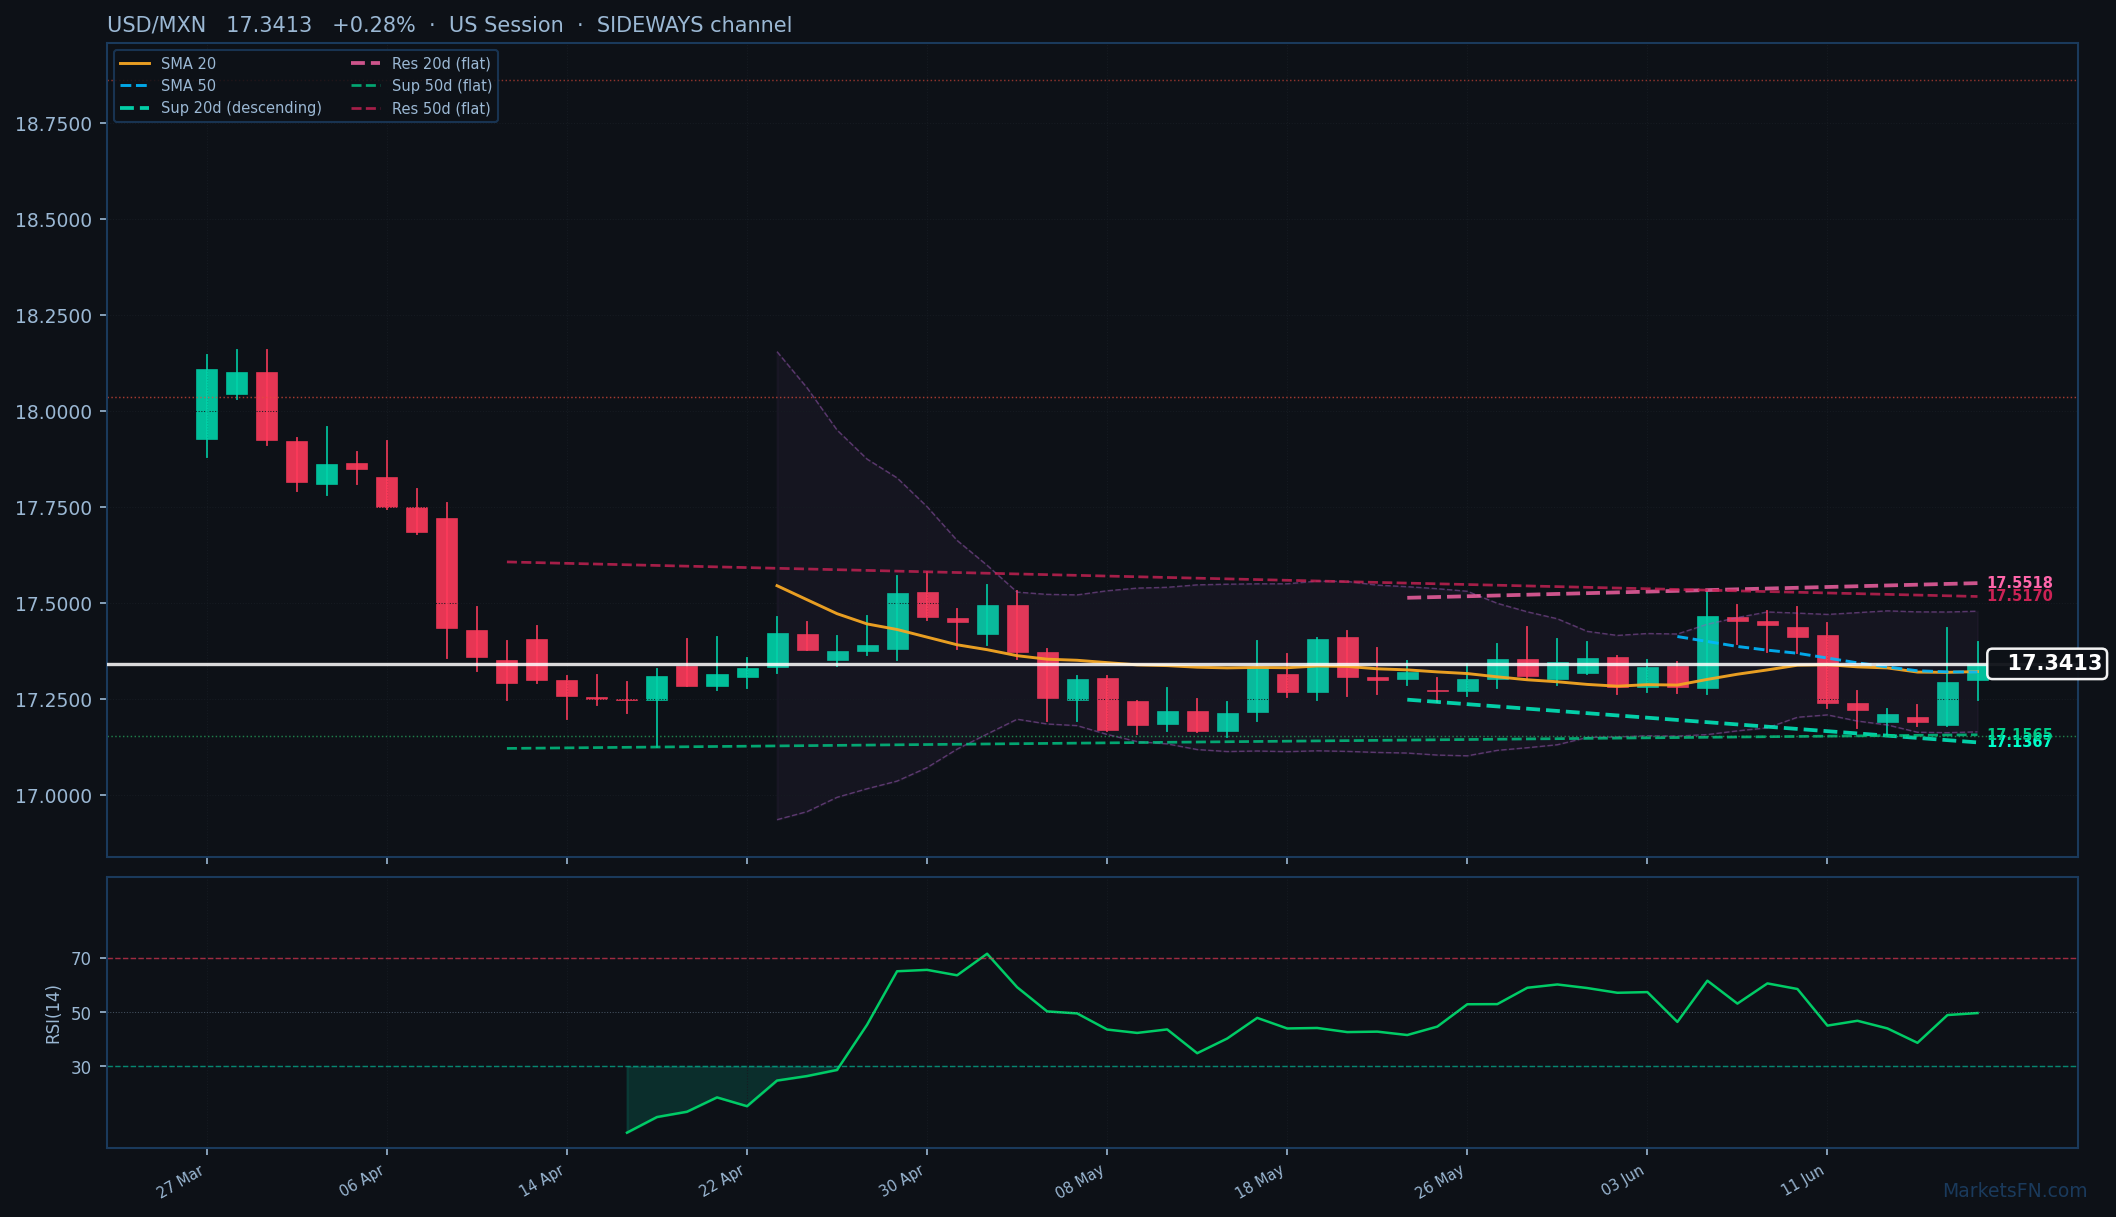
USD/MXN: Up 0.28% to 17.3413 — Bullish — Above Key MAs
Published: June 18, 2026 · MarketsFN Team · US Session · Emerging FX
| Pair | Rate | Change | RSI(14) | SMA-20 | SMA-50 | 52W High | 52W Low | Pivot | R1 | S1 |
|---|---|---|---|---|---|---|---|---|---|---|
| USD/MXN | 17.3413 | +0.28% | 49.7 | 17.3213 | 17.3201 | 18.8908 | 17.1190 | 17.3022 | 17.4256 | 17.1699 |
S/R Support & Resistance Levels
Dynamic Trendlines
| Level | Type | Direction | Distance |
|---|---|---|---|
| 17.1367 | 20d Support | down (descending) | -1.18% / 2046.8 pips |
| 17.5518 | 20d Resistance | flat (flat) | +1.21% / 2104.3 pips |
| 17.1565 | 50d Support | flat (flat) | -1.07% / 1848.1 pips |
| 17.5170 | 50d Resistance | flat (flat) | +1.01% / 1756.5 pips |
Static Levels
| Level | Type | Touches | Distance |
|---|---|---|---|
| 18.8632 | Resistance | 2x | +8.78% / 15218.7 pips |
| 18.0365 | Resistance | 2x | +4.01% / 6951.4 pips |
| 17.1529 | Support | 2x | -1.09% / 1884.6 pips |
USD/MXN is trading at 17.3413 (+0.28%), showing tentative bullish momentum as it holds above both the SMA-20 (17.3213) and SMA-50 (17.3201), suggesting a potential uptrend confirmation if the cross closes decisively above these moving averages. The price action is currently testing the upper bounds of a sideways 20-day channel, with immediate dynamic resistance at 17.5518 (+1.21%, 2104.3 pips away) and dynamic support at 17.1367 (-1.18%, 2046.8 pips away) — both trendlines are descending, indicating weakening bearish pressure. Static levels reveal a more congested near-term range, with S1 support at 17.1529 (-1.08%, 1884.6 pips away) and R1 resistance at 18.0365 (+4.01%, 6951.4 pips away), though the latter remains distant and likely irrelevant for intraday trading. RSI at 49.7 sits in neutral territory, offering no clear divergence signals, while the ATR(14) of 0.1280 suggests subdued volatility. The short-term outlook leans cautiously bullish, but traders should watch for a breakout above the 20-day dynamic resistance (17.5518) to confirm upside momentum. A failure to hold above the SMAs could see a retest of static support at 17.1529. The next catalyst will be the Bank of Mexico's rate decision — any dovish tilt could trigger a test of the 50-day dynamic resistance at 17.5170.
Disclaimer
The content on MarketsFN.com is provided for educational and informational purposes only and does not constitute financial advice. All investments involve risk and past performance does not guarantee future results.


