USD/MXN: Up 0.04% to 17.4031 — Descending Channel
MarketsFN Team
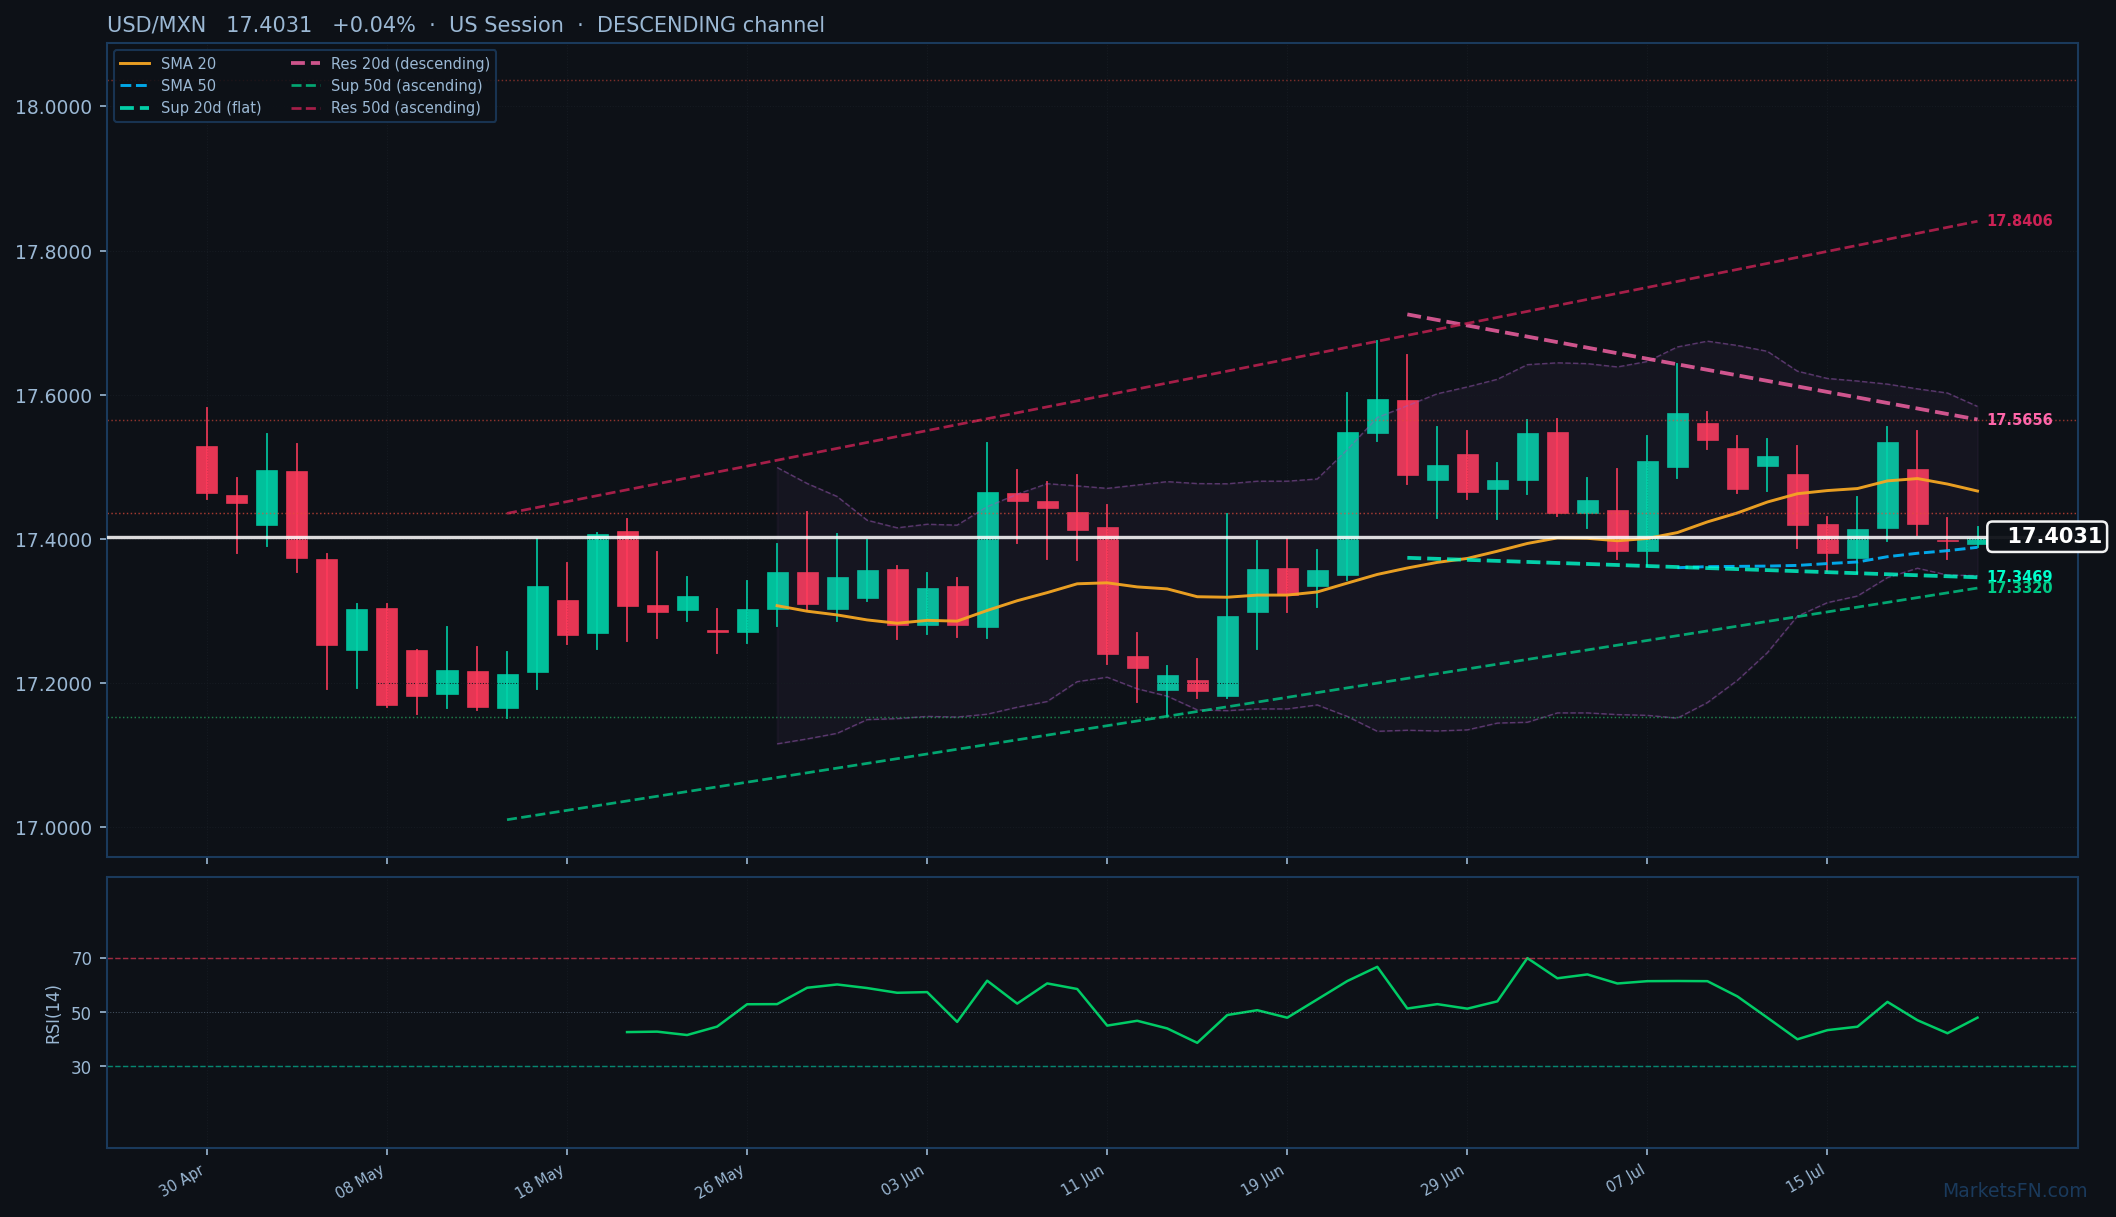
USD/MXN: Up 0.04% to 17.4031 — Descending Channel
Published: July 22, 2026 · MarketsFN Team · US Session · Emerging FX
| Pair | Rate | Change | RSI(14) | SMA-20 | SMA-50 | 52W High | 52W Low | Pivot | R1 | S1 |
|---|---|---|---|---|---|---|---|---|---|---|
| USD/MXN | 17.4031 | +0.04% | 48.0 | 17.4665 | 17.3885 | 18.8908 | 17.1190 | 17.3996 | 17.4264 | 17.3699 |
S/R Support & Resistance Levels
Dynamic Trendlines
| Level | Type | Direction | Distance |
|---|---|---|---|
| 17.3469 | 20d Support | flat (flat) | -0.32% / 562.6 pips |
| 17.5656 | 20d Resistance | down (descending) | +0.93% / 1625.2 pips |
| 17.3320 | 50d Support | up (ascending) | -0.41% / 711.6 pips |
| 17.8406 | 50d Resistance | up (ascending) | +2.51% / 4374.7 pips |
Static Levels
| Level | Type | Touches | Distance |
|---|---|---|---|
| 18.0365 | Resistance | 2x | +3.65% / 6354.7 pips |
| 17.5648 | Resistance | 2x | +0.94% / 1637.6 pips |
| 17.4358 | Resistance | 2x | +0.20% / 347.7 pips |
| 17.1529 | Support | 2x | -1.43% / 2481.3 pips |
USD/MXN is trading at 17.4031 (+0.04%), trapped in a consolidation phase between its SMA-20 (17.4665, 634.4 pips above) and SMA-50 (17.3885, 146.6 pips below). The pair is caught between conflicting channel dynamics — the 20-day channel is descending (resistance at 17.5656, +1625.2 pips) while the 50-day channel is ascending (support at 17.3320, -711.6 pips). This technical tug-of-war reflects indecision, with price action confined to a tight 271.1-pip daily range (17.3894–17.4165) as European traders test the pivot at 17.3996.
Nearest static resistance (R1 at 17.4358, +347.7 pips) aligns with the July 15 high, while support (S1 at 17.1529, -2481.3 pips) remains distant — leaving immediate focus on dynamic levels. The RSI at 48.0 shows neutral momentum, but the descending 20-day resistance trendline suggests bearish pressure could intensify if USD/MXN fails to reclaim 17.4665 (SMA-20). ATR(14) of 0.1030 signals compressed volatility, typical before directional breaks.
Short-term, the pair is vulnerable to a test of 50-day ascending support (17.3320) if it loses the SMA-50 (17.3885). Upside requires clearing both the 20-day SMA and descending resistance — a tall order without fresh catalysts. Watch for a close above 17.4264 (daily R1) to signal bullish momentum, while a break below 17.3699 (daily S1) would confirm bearish control. The 50-day channel’s upward slope suggests any dip may find buyers near 17.33.
Disclaimer
The content on MarketsFN.com is provided for educational and informational purposes only and does not constitute financial advice. All investments involve risk and past performance does not guarantee future results.

