USD/MXN: Up 0.03% to 17.3423 — Descending Channel
MarketsFN Team
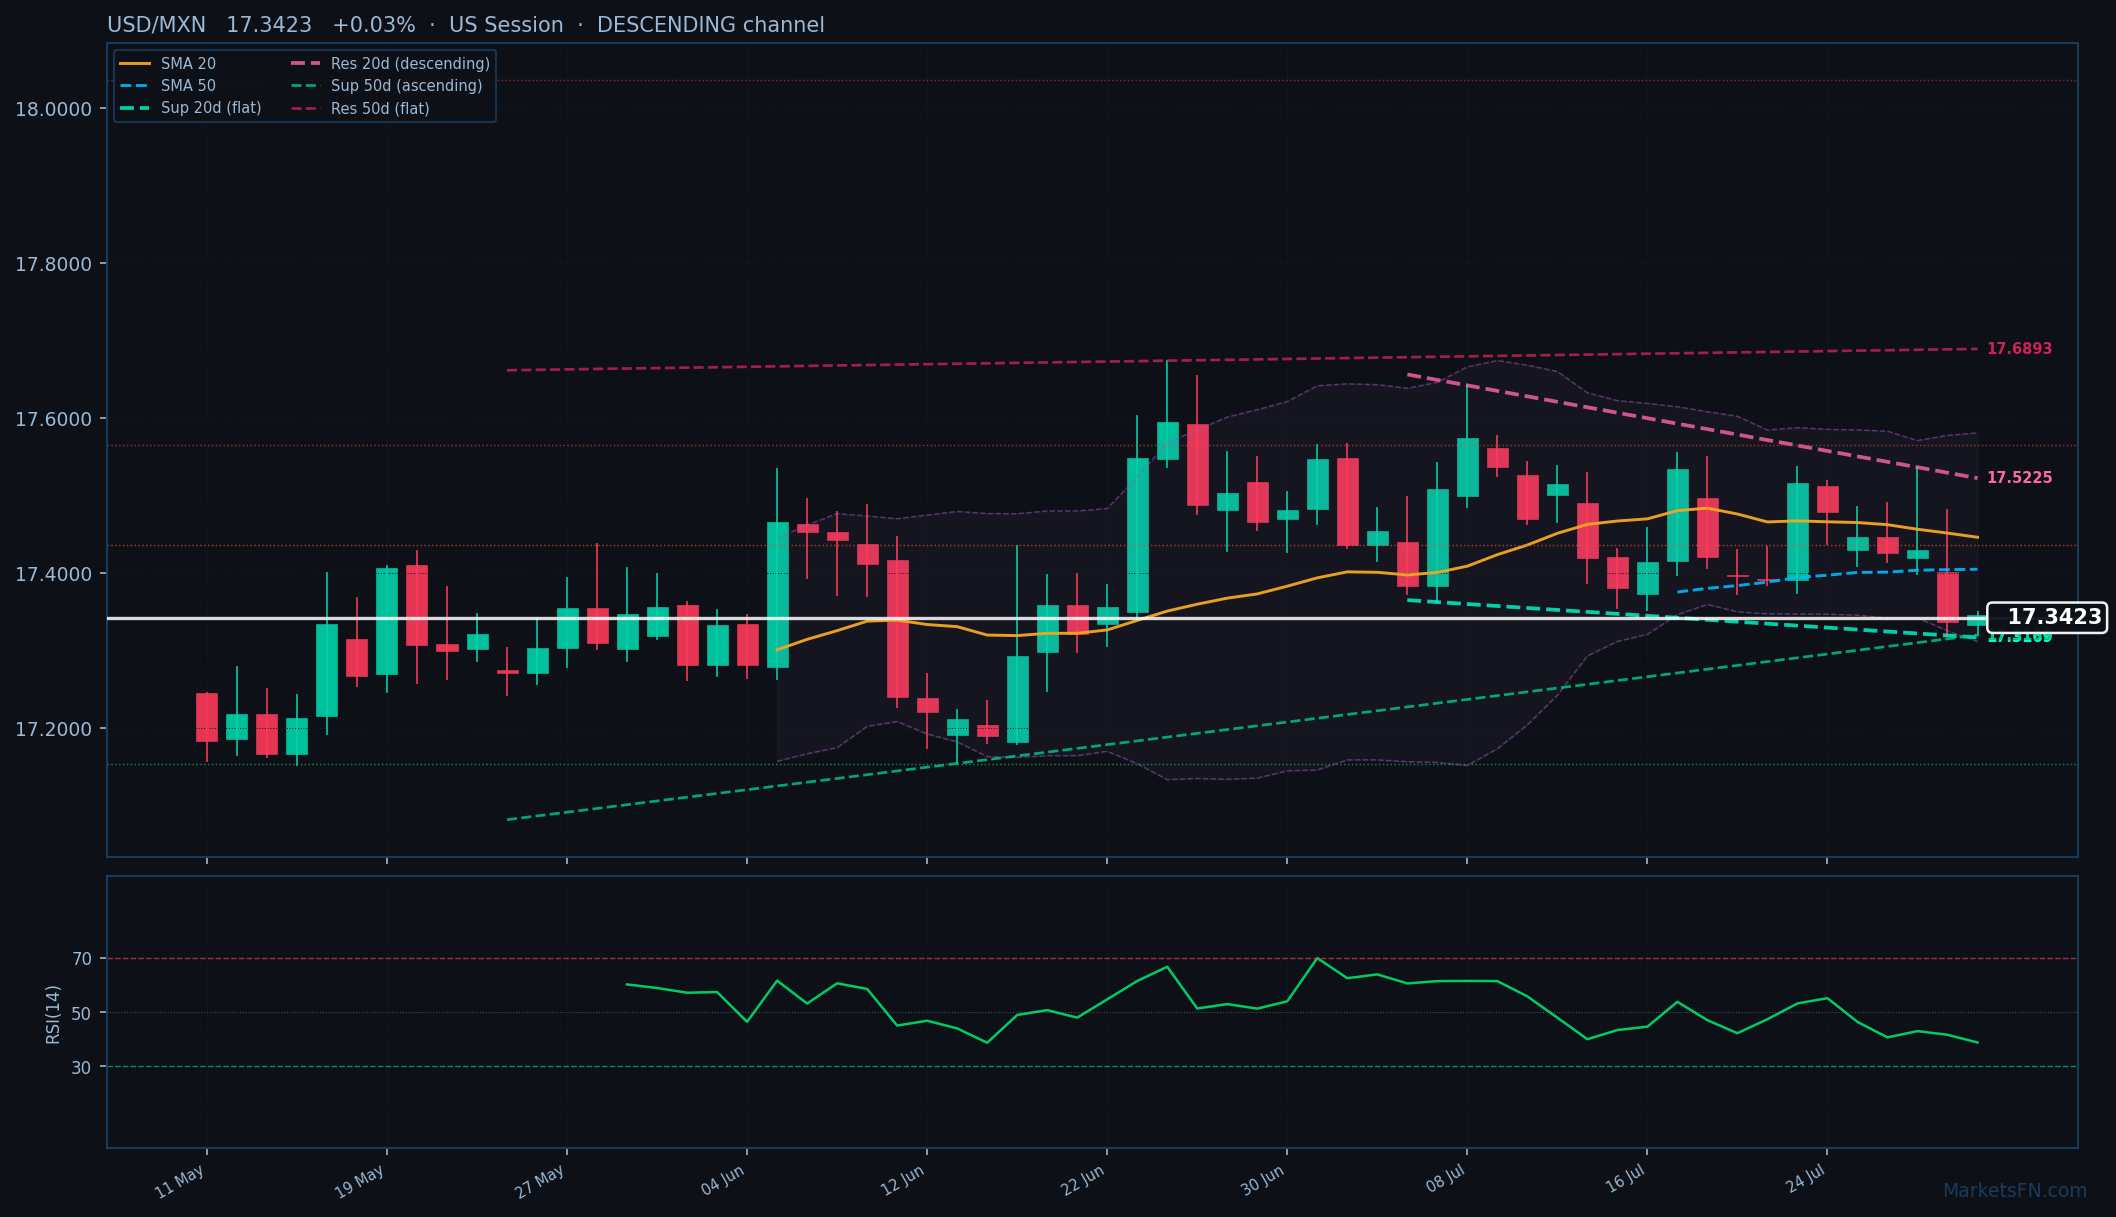
USD/MXN: Up 0.03% to 17.3423 — Descending Channel
Published: July 31, 2026 · MarketsFN Team · US Session · Emerging FX
| Pair | Rate | Change | RSI(14) | SMA-20 | SMA-50 | 52W High | 52W Low | Pivot | R1 | S1 |
|---|---|---|---|---|---|---|---|---|---|---|
| USD/MXN | 17.3423 | +0.03% | 38.8 | 17.4462 | 17.4049 | 18.8114 | 17.1190 | 17.3794 | 17.4395 | 17.2772 |
S/R Support & Resistance Levels
Dynamic Trendlines
| Level | Type | Direction | Distance |
|---|---|---|---|
| 17.3169 | 20d Support | flat (flat) | -0.15% / 253.6 pips |
| 17.5225 | 20d Resistance | down (descending) | +1.04% / 1802.1 pips |
| 17.3199 | 50d Support | up (ascending) | -0.13% / 223.8 pips |
| 17.6893 | 50d Resistance | flat (flat) | +2.00% / 3470.5 pips |
Static Levels
| Level | Type | Touches | Distance |
|---|---|---|---|
| 18.0365 | Resistance | 2x | +3.98% / 6903.2 pips |
| 17.5648 | Resistance | 2x | +1.26% / 2186.1 pips |
| 17.4358 | Resistance | 2x | +0.52% / 896.2 pips |
| 17.1529 | Support | 2x | -1.11% / 1932.8 pips |
USD/MXN is trading at 17.3423 (+0.03%) as it continues to reflect a downtrend, with the rate positioned below both the 20-day simple moving average (SMA) of 17.4462 and the 50-day SMA of 17.4049. This positioning indicates bearish sentiment in the market. The 20-day dynamic resistance trendline is descending at 17.5225, which is 1802.1 pips above the current rate, while the nearest dynamic support trendline is flat at 17.3169, just 253.6 pips below.
In terms of static levels, the closest support level, S1, is at 17.1529, which is 1932.8 pips away, while the nearest resistance level, R1, is at 17.4358, 896.2 pips above the current price. The Relative Strength Index (RSI) is at 38.8, indicating neutral territory, suggesting that the market lacks strong momentum in either direction.
Short-term, the outlook for USD/MXN appears cautious as it remains trapped within a descending channel. The proximity to the dynamic support trendline at 17.3169 could provide a temporary floor, but a breach below this level may trigger further selling pressure. Conversely, a rally towards the dynamic resistance at 17.5225 would require a significant shift in market sentiment. Traders should watch for any developments that could influence the peso, particularly economic data releases or shifts in U.S. monetary policy, which could act as catalysts for movement in this currency pair.
Disclaimer
The content on MarketsFN.com is provided for educational and informational purposes only and does not constitute financial advice. All investments involve risk and past performance does not guarantee future results.


