USD/MXN: Down 0.66% to 18.1659 — RSI Overbought
MarketsFN Team
USD/MXN: Down 0.66% to 18.1659 — RSI Overbought
Published: October 02, 2026 · MarketsFN Team · US Session · Emerging FX
| Pair | Rate | Change | RSI(14) | SMA-20 | SMA-50 | 52W High | 52W Low | Pivot | R1 | S1 |
|---|---|---|---|---|---|---|---|---|---|---|
| USD/MXN | 18.1659 | -0.66% | 83.9 | 17.4260 | 17.2288 | 18.6856 | 16.8835 | 18.2515 | 18.4634 | 18.0741 |
S/R Support & Resistance Levels
Dynamic Trendlines
| Level | Type | Direction | Distance |
|---|---|---|---|
| 17.6600 | 20d Support | up (ascending) | -2.79% / 5059.5 pips |
| 18.5159 | 20d Resistance | up (ascending) | +1.93% / 3499.3 pips |
| 17.0159 | 50d Support | up (ascending) | -6.33% / 11500.3 pips |
| 18.4489 | 50d Resistance | up (ascending) | +1.56% / 2829.2 pips |
Static Levels
| Level | Type | Touches | Distance |
|---|---|---|---|
| 18.8632 | Resistance | 2x | +3.84% / 6973.0 pips |
| 17.8683 | Support | 2x | -1.64% / 2976.0 pips |
| 17.1529 | Support | 2x | -5.58% / 10130.3 pips |
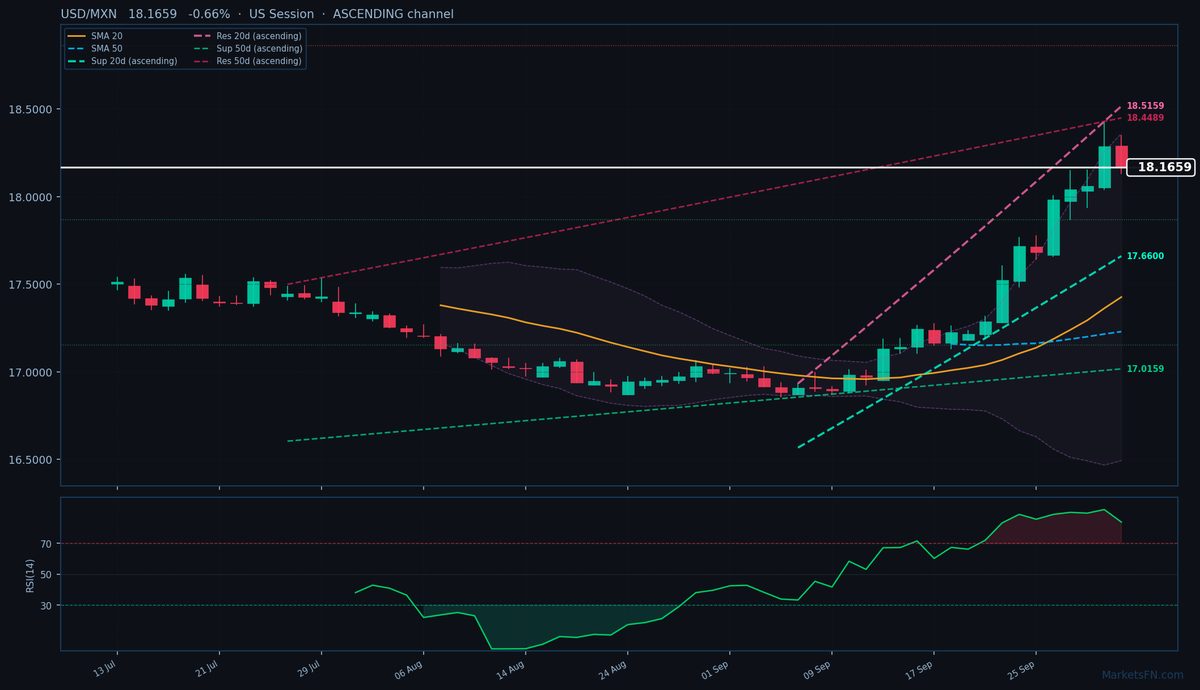
USD/MXN is trading at 18.1659 (-0.66%), pulling back from yesterday's close of 18.2860 but maintaining a firm uptrend as price holds well above both the 20-day SMA (17.4260) and 50-day SMA (17.2288). The pair remains in an ascending 20-day dynamic channel, with immediate resistance at 18.5159 (+1.93%, 3499.3 pips above) and support at 17.6600 (-2.78%, 5059.5 pips below). The 50-day channel confirms the broader bullish structure, with resistance at 18.4489 (+1.56%, 2829.2 pips away) and support far below at 17.0159 (-6.33%, 11500.3 pips away).
Static levels show S1 support at 17.8683 (2976.0 pips below), while R1 resistance looms at 18.8632 (6973.0 pips above) — a level that has rejected price twice before. The RSI at 83.9 screams overbought, suggesting this pullback may extend, but the ascending channels and SMA positioning argue against a deep correction. With the ATR(14) at 0.2038, today's range of 18.1312–18.3486 aligns with typical volatility.
Short-term, the dip toward S1 pivot at 18.0741 could attract buyers if the uptrend holds. A break below 18.1312 (today's low) would test the market's conviction in the rally, while reclaiming 18.2515 (pivot) would signal renewed bullish momentum. Watch for a potential RSI reset to alleviate overbought pressure without breaking the 20-day dynamic support. The European session's price action will set the tone for whether this is a healthy consolidation or the start of a deeper pullback.
Disclaimer
The content on MarketsFN.com is provided for educational and informational purposes only and does not constitute financial advice. All investments involve risk and past performance does not guarantee future results.