USD/THB: Down 0.48% to 33.4720 — RSI Overbought
MarketsFN Team
USD/THB: Down 0.48% to 33.4720 — RSI Overbought
Published: October 02, 2026 · MarketsFN Team · US Session · Emerging FX
| Pair | Rate | Change | RSI(14) | SMA-20 | SMA-50 | 52W High | 52W Low | Pivot | R1 | S1 |
|---|---|---|---|---|---|---|---|---|---|---|
| USD/THB | 33.4720 | -0.48% | 71.6 | 33.1977 | 33.1270 | 33.7470 | 30.5160 | 33.4330 | 33.6740 | 33.2590 |
S/R Support & Resistance Levels
Dynamic Trendlines
| Level | Type | Direction | Distance |
|---|---|---|---|
| 32.8561 | 20d Support | up (ascending) | -1.84% / 6159.1 pips |
| 33.7614 | 20d Resistance | up (ascending) | +0.86% / 2893.7 pips |
| 32.2125 | 50d Support | flat (flat) | -3.76% / 12595.3 pips |
| 33.7008 | 50d Resistance | flat (flat) | +0.68% / 2287.6 pips |
Static Levels
| Level | Type | Touches | Distance |
|---|---|---|---|
| 32.4945 | Support | 2x | -3.38% / 11375.0 pips |
| 32.4505 | Support | 2x | -3.51% / 11815.0 pips |
| 32.2535 | Support | 2x | -4.10% / 13785.0 pips |
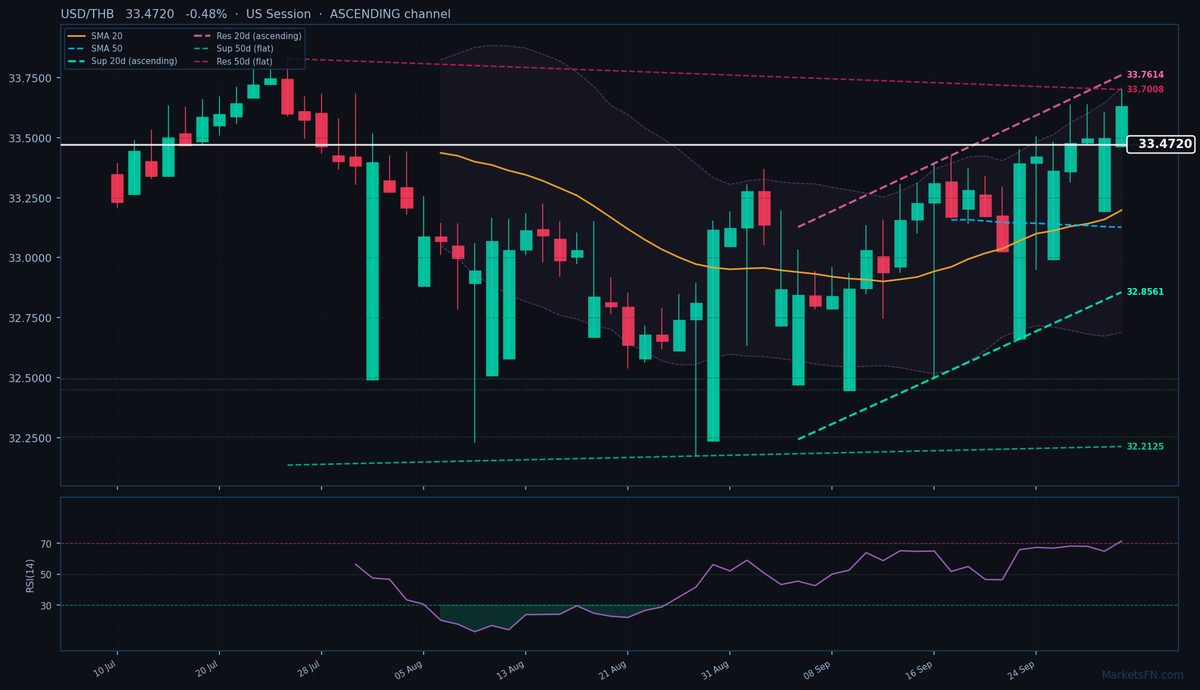
USD/THB is trading at 33.4720 (-0.48%), pulling back from yesterday's close at 33.6320 but maintaining a firm uptrend above both the 20-day (33.1977) and 50-day (33.1270) SMAs. The pair remains in an ascending 20-day dynamic channel, with immediate resistance at 33.7614 (+0.38%, 2893.7 pips above) and support at 32.8561 (-2.31%, 6159.1 pips below). The 50-day channel is flat, suggesting consolidation may emerge at higher levels, but the current price action favors continuation as long as the 20-day SMA holds.
Static levels show the nearest pivot support at 33.4330 (just 390 pips below current), with R1 resistance at 33.6740 (+0.60%, 2020 pips above). The RSI at 71.6 signals overbought conditions, but in strong trends, this can persist — watch for a break below 70 to confirm any near-term exhaustion. Today's low at 33.4620 aligns closely with the pivot, making it a critical intraday level to hold for bulls.
Short-term, the path of least resistance remains higher toward the 52-week high at 33.7470 (+0.82%, 2750 pips away), though profit-taking risks grow as the RSI extends. A close below 33.4330 would signal a deeper pullback toward the 20-day SMA. The European session's price action will test whether the overnight dip attracts fresh bids or extends toward S1 at 33.2590 (-0.64%, 2130 pips below).
Disclaimer
The content on MarketsFN.com is provided for educational and informational purposes only and does not constitute financial advice. All investments involve risk and past performance does not guarantee future results.