USD/MXN: Down 0.10% to 17.0137 — Descending Channel
MarketsFN Team
USD/MXN: Down 0.10% to 17.0137 — Descending Channel
Published: August 31, 2026 · MarketsFN Team · US Session · Emerging FX
| Pair | Rate | Change | RSI(14) | SMA-20 | SMA-50 | 52W High | 52W Low | Pivot | R1 | S1 |
|---|---|---|---|---|---|---|---|---|---|---|
| USD/MXN | 17.0137 | -0.10% | 42.6 | 17.0443 | 17.2929 | 18.6856 | 16.9164 | 17.0118 | 17.0815 | 16.9611 |
S/R Support & Resistance Levels
Dynamic Trendlines
| Level | Type | Direction | Distance |
|---|---|---|---|
| 16.7865 | 20d Support | down (descending) | -1.34% / 2272.0 pips |
| 17.0477 | 20d Resistance | down (descending) | +0.20% / 339.5 pips |
| 16.8162 | 50d Support | down (descending) | -1.16% / 1975.2 pips |
| 17.2294 | 50d Resistance | down (descending) | +1.27% / 2156.9 pips |
Static Levels
| Level | Type | Touches | Distance |
|---|---|---|---|
| 17.5648 | Resistance | 2x | +3.19% / 5434.3 pips |
| 17.5352 | Resistance | 2x | +3.02% / 5138.4 pips |
| 17.4358 | Resistance | 2x | +2.43% / 4144.4 pips |
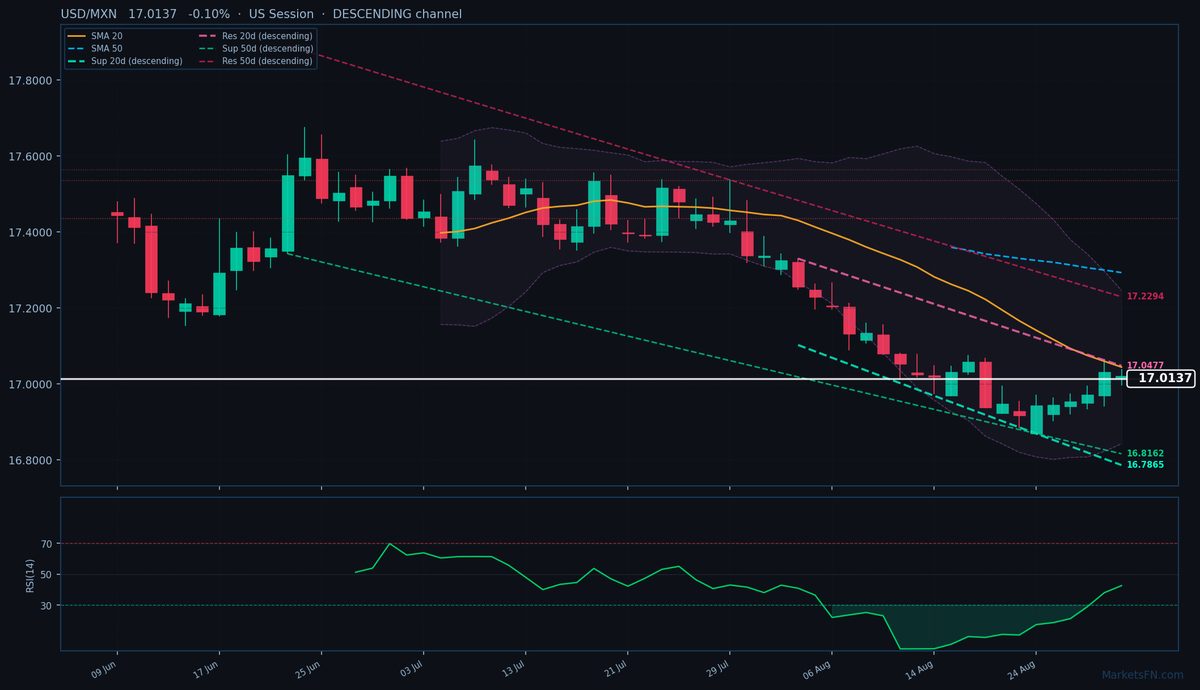
USD/MXN is trading at 17.0137 (-0.10%), testing the lower bounds of a well-defined descending channel as bearish momentum persists. The pair remains below both the 20-day (17.0443) and 50-day (17.2929) SMAs, confirming the downtrend’s structural integrity. Current price action sits just 339.5 pips below the 20-day dynamic resistance trendline at 17.0477, while the descending 20-day support trendline looms 2,272.0 pips lower at 16.7865. The 50-day channel mirrors this bearish structure, with resistance at 17.2294 (+1.22%) and support at 16.8162 (-1.21%).
Static levels reinforce the bearish setup, with S1 pivot support at 16.9611 (-0.31%, 525.9 pips away) as the nearest floor, while R1 resistance at 17.0815 (+0.40%) aligns closely with the dynamic channel’s upper boundary. RSI at 42.6 shows neutral momentum, but the absence of oversold conditions suggests room for further downside before a technical rebound.
The immediate risk is a break below the 17.0118 pivot, which could accelerate selling toward S1. However, the tight 20-day dynamic resistance (17.0477) caps upside attempts, making rallies sellable. Watch for a close below 16.9978 (today’s low) to confirm bearish continuation, while a sustained break above 17.0477 would challenge the downtrend’s validity. The European session’s muted volatility (ATR 0.0737) hints at potential breakout momentum later in the day.
Disclaimer
The content on MarketsFN.com is provided for educational and informational purposes only and does not constitute financial advice. All investments involve risk and past performance does not guarantee future results.