FX Evening Briefing — Wed 14 Oct 2026: USD/SEK Closes Higher 1.23% — Asian Session Preview
MarketsFN FX Desk

Evening wrap-up for Wednesday 14 October 2026: as European markets close and the US session enters its final hours, G10 and emerging FX markets are closing with 12 pairs higher and 7 lower on the day. The standout movers are USD/SEK (+1.23%), USD/MXN (+1.18%), USD/ZAR (+0.94%). End-of-day flows — institutional rebalancing, month-end positioning and any late US data surprises — are the main drivers for tonight's Asian handoff.
This evening briefing includes the full day's economic calendar with all released actuals, final intraday pivot levels, and updated candlestick charts for all 19 pairs. Pivot levels will reset at tomorrow's EU open based on today's completed daily bars.
All pivot levels (R1 R2 R3 / S1 S2 S3) are computed from yesterday's full-session OHLC. Asian session key levels and carry trade dynamics are highlighted in each pair's analysis below.
Today's Economic Calendar — Full Day Results
| Time (UTC) | Event | CCY | Previous | Forecast | Actual |
|---|---|---|---|---|---|
| 01:30 | ● CPI (YoY) (Sep) | CNY | 0.8% | 1.0% | 0.9% |
| 01:30 | ● CPI (MoM) (Sep) | CNY | 0.4% | 0.3% | 0.2% |
| 01:30 | ● PPI (YoY) (Sep) | CNY | 3.8% | 4.4% | 5.0% |
| 02:10 | ● ECB President Lagarde Speaks | EUR | — | — | — |
| 02:30 | ● Exports (YoY) (Sep) | CNY | 25.0% | 25.5% | 36.3% |
| 02:30 | ● Imports (YoY) (Sep) | CNY | 28.2% | 24.5% | 31.0% |
| 02:30 | ● Trade Balance (USD) (Sep) | CNY | 119.09B | 116.80B | 133.53B |
| 05:30 | ● BoE Gov Bailey Speaks | GBP | — | — | — |
| 06:00 | ● BoE MPC Member Pill Speaks | GBP | — | — | — |
| 06:05 | ● BoC Gov Macklem Speaks | CAD | — | — | — |
| 06:30 | ● WPI Inflation (YoY) (Sep) | INR | 9.92% | 10.18% | 11.39% |
| 07:00 | ● Spanish CPI (YoY) (Sep) | EUR | 4.3% | 4.9% | 4.9% |
| 07:00 | ● Spanish HICP (YoY) (Sep) | EUR | 4.6% | 5.0% | 5.0% |
| 08:00 | ● New Loans (Sep) | CNY | 60.0B | 1,025.0B | 1,080.0B |
| 08:00 | ● ECB's Elderson Speaks | EUR | — | — | — |
| 08:15 | ● German Buba Vice President Buch Speaks | EUR | — | — | — |
| 08:30 | ● ECB President Lagarde Speaks | EUR | — | — | — |
| 09:00 | ● IEA Monthly Report | USD | — | — | — |
| 09:40 | ● FOMC Member Bowman Speaks | USD | — | — | — |
| 10:00 | ● Euro Summit | EUR | — | — | — |
| 12:30 | ● Core CPI (MoM) (Sep) | USD | 0.3% | 0.2% | 0.3% |
| 12:30 | ● Core CPI (YoY) (Sep) | USD | 2.4% | 2.5% | 2.6% |
| 12:30 | ● CPI (YoY) (Sep) | USD | 3.4% | 3.6% | 3.7% |
| 12:30 | ● CPI (MoM) (Sep) | USD | 0.4% | 0.6% | 0.6% |
| 12:30 | ● Building Permits (MoM) (Aug) | CAD | -15.8% | 2.9% | 8.8% |
| 16:15 | ● ECB's Schnabel Speaks | EUR | — | — | — |
| 18:00 | ● Beige Book | USD | — | — | — |
| 20:30 | ● API Weekly Crude Oil Stock | USD | -2.090M | 1.900M | — |
Major Pairs
EUR/USD
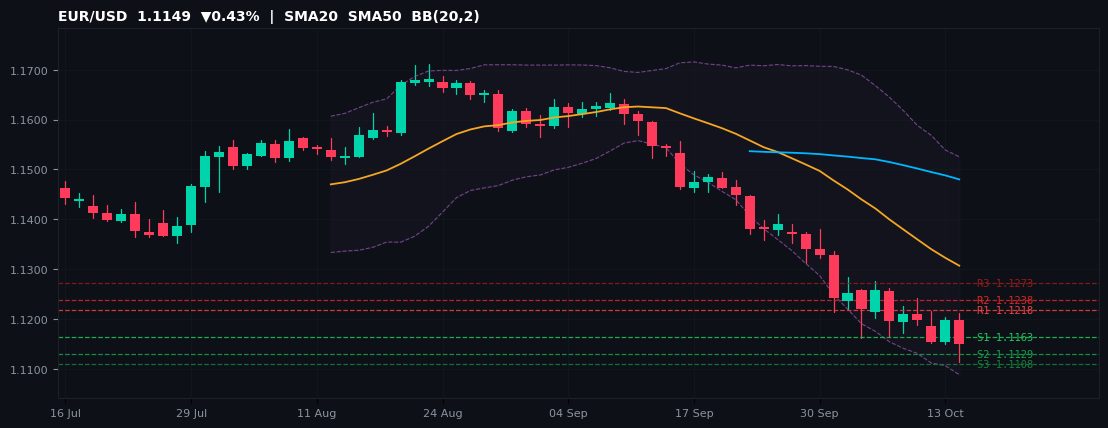
1.1149 ▼0.43% Day H 1.1211 / L 1.1112 52W 1.1112–1.2082
| R3 | R2 | R1 | S1 | S2 | S3 |
|---|---|---|---|---|---|
| 1.1273 | 1.1238 | 1.1218 | 1.1163 | 1.1129 | 1.1108 |
End-of-day snapshot for EUR/USD: closing at 1.1149 (-0.43% on the day), just 0.33% above its 52-week floor at 1.1112. Today's full-session range of 1.1112–1.1211 (0.0099 points). The daily close below the pivot (1.1184) signals bearish momentum into tomorrow's Asian open.
For tomorrow's Asian open, the key pivot reference levels remain: R1 1.1218 / R2 1.1238 / R3 1.1273 on the upside and S1 1.1163 / S2 1.1129 / S3 1.1108 on the downside. Asian session liquidity is typically thinner, so gaps through pivot levels should be monitored carefully.
EUR/USD finishes the day the annual support is under watch — a close below would reset the technical outlook bearish. The 52-week range of 1.1112–1.2082 places the pair at the 4th percentile. Key overnight risk: Asian economic data and any after-hours US developments that could reprice the USD complex before London re-opens.
EUR/USDBearishBelow S1Near 52W Low
GBP/USD
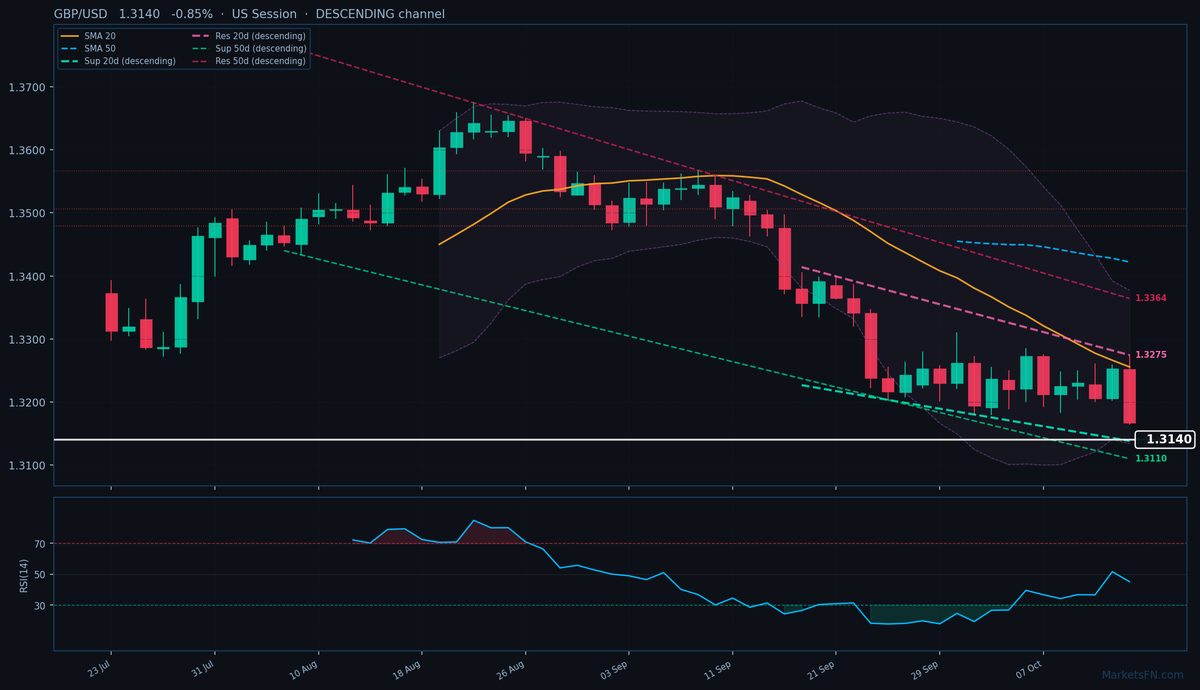
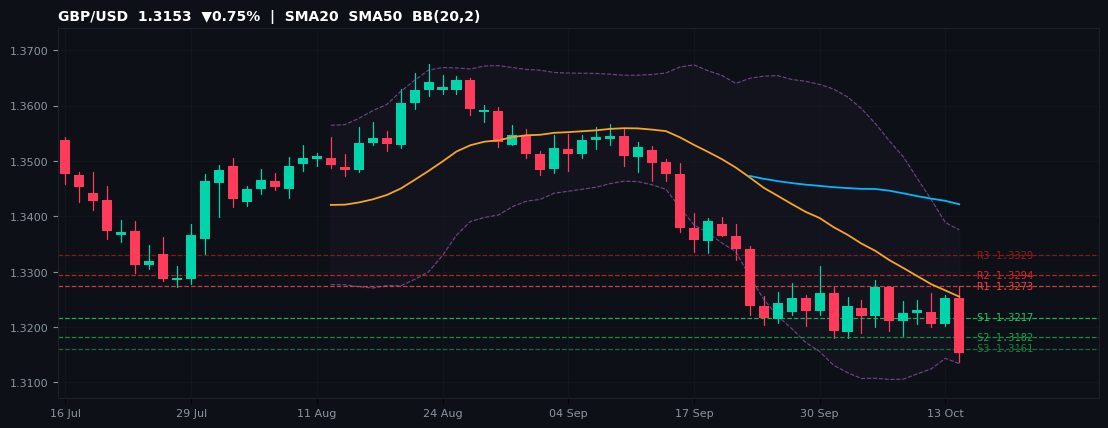
1.3153 ▼0.75% Day H 1.3275 / L 1.3136 52W 1.3009–1.3868
| R3 | R2 | R1 | S1 | S2 | S3 |
|---|---|---|---|---|---|
| 1.3329 | 1.3294 | 1.3273 | 1.3217 | 1.3182 | 1.3161 |
End-of-day snapshot for GBP/USD: closing at 1.3153 (-0.75% on the day), just 1.10% above its 52-week floor at 1.3009. Today's full-session range of 1.3136–1.3275 (0.0138 points). The daily close below the pivot (1.3238) signals bearish momentum into tomorrow's Asian open.
For tomorrow's Asian open, the key pivot reference levels remain: R1 1.3273 / R2 1.3294 / R3 1.3329 on the upside and S1 1.3217 / S2 1.3182 / S3 1.3161 on the downside. Asian session liquidity is typically thinner, so gaps through pivot levels should be monitored carefully.
GBP/USD finishes the day the annual support is under watch — a close below would reset the technical outlook bearish. The 52-week range of 1.3009–1.3868 places the pair at the 17th percentile. Key overnight risk: Asian economic data and any after-hours US developments that could reprice the USD complex before London re-opens.
GBP/USDBearishBelow S1Near 52W Low
USD/JPY
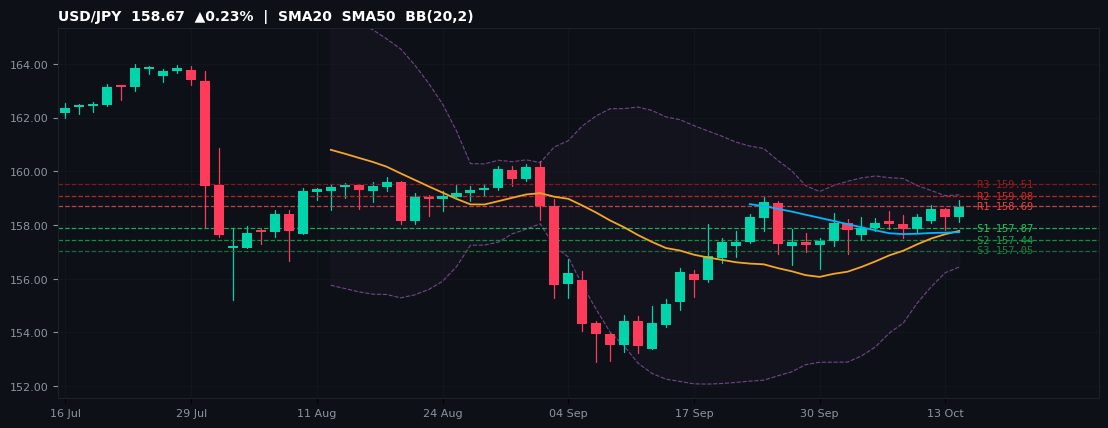
158.67 ▲0.23% Day H 158.95 / L 158.11 52W 151.53–163.98
| R3 | R2 | R1 | S1 | S2 | S3 |
|---|---|---|---|---|---|
| 159.51 | 159.08 | 158.69 | 157.87 | 157.44 | 157.05 |
End-of-day snapshot for USD/JPY: closing at 158.67 (+0.23% on the day), at the 57th percentile of its 151.53–163.98 52-week range. Today's full-session range of 158.11–158.95 (0.84 points). The daily close above the pivot (158.26) signals bullish continuation into tomorrow's Asian open.
For tomorrow's Asian open, the key pivot reference levels remain: R1 158.69 / R2 159.08 / R3 159.51 on the upside and S1 157.87 / S2 157.44 / S3 157.05 on the downside. Asian session liquidity is typically thinner, so gaps through pivot levels should be monitored carefully.
USD/JPY finishes the day the pair is closing in the upper half of its annual range, a constructive sign for bulls. The 52-week range of 151.53–163.98 places the pair at the 57th percentile. Key overnight risk: Asian economic data and any after-hours US developments that could reprice the USD complex before London re-opens.
USD/JPYRangebound
USD/CHF
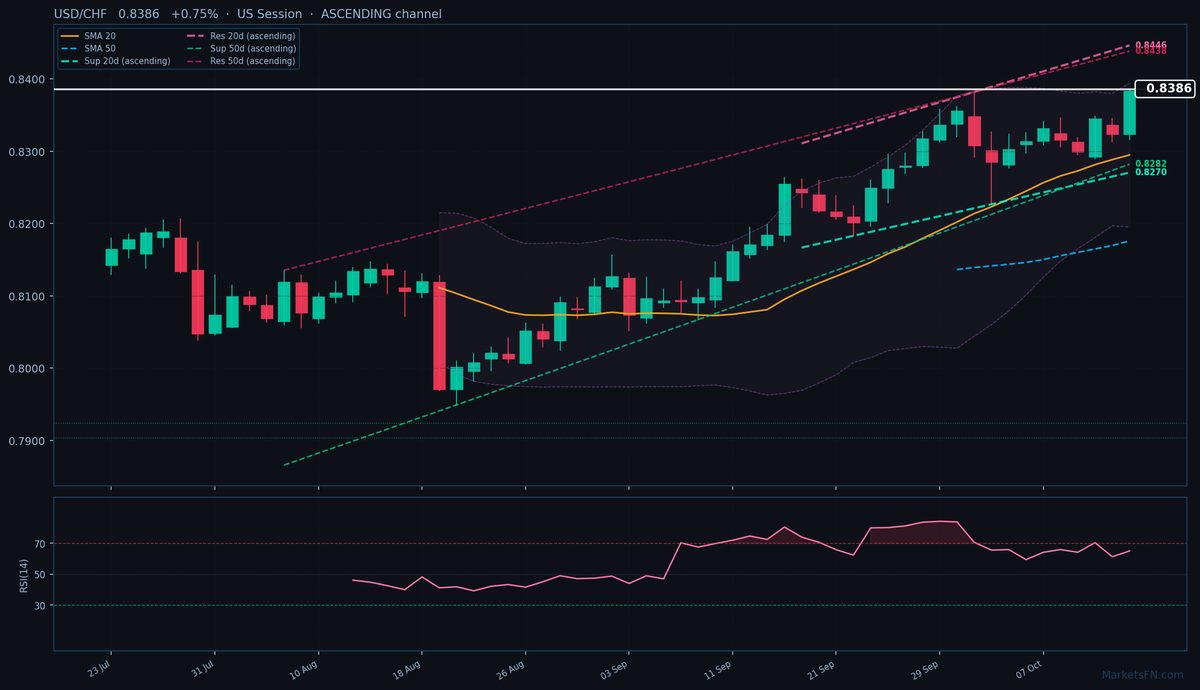
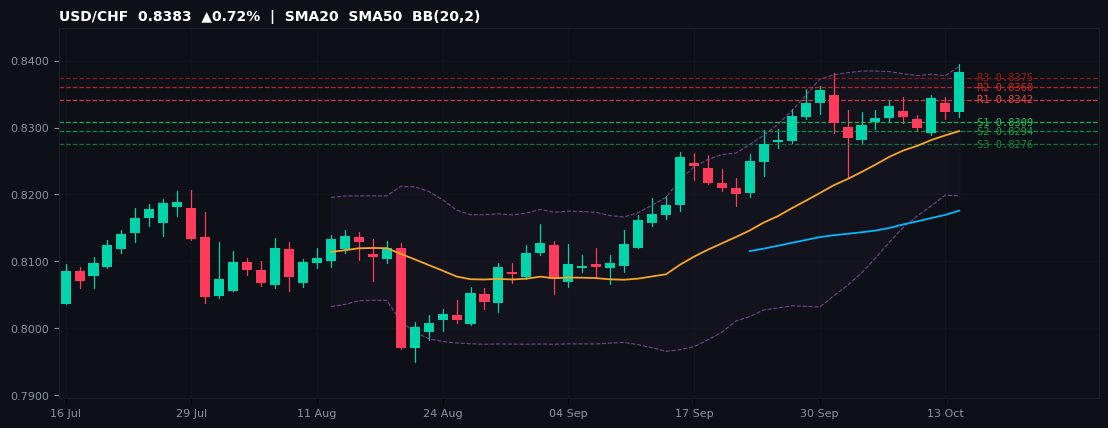
0.8383 ▲0.72% Day H 0.8395 / L 0.8316 52W 0.7602–0.8395
| R3 | R2 | R1 | S1 | S2 | S3 |
|---|---|---|---|---|---|
| 0.8375 | 0.8360 | 0.8342 | 0.8309 | 0.8294 | 0.8276 |
End-of-day snapshot for USD/CHF: closing at 0.8383 (+0.72% on the day), just 0.13% below its 52-week high of 0.8395. Today's full-session range of 0.8316–0.8395 (0.0078 points). The daily close above the pivot (0.8327) signals bullish continuation into tomorrow's Asian open.
For tomorrow's Asian open, the key pivot reference levels remain: R1 0.8342 / R2 0.8360 / R3 0.8375 on the upside and S1 0.8309 / S2 0.8294 / S3 0.8276 on the downside. Asian session liquidity is typically thinner, so gaps through pivot levels should be monitored carefully.
USD/CHF finishes the day the trend is intact; bulls will target a break above the annual high on the next catalyst. The 52-week range of 0.7602–0.8395 places the pair at the 99th percentile. Key overnight risk: Asian economic data and any after-hours US developments that could reprice the USD complex before London re-opens.
USD/CHFBullishAbove R1Near 52W High
AUD/USD
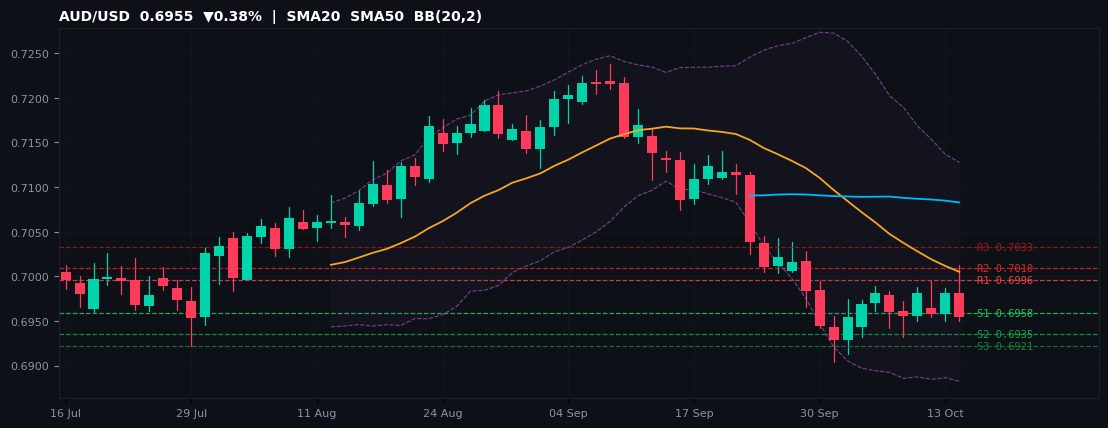
0.6955 ▼0.38% Day H 0.7013 / L 0.6950 52W 0.6421–0.7277
| R3 | R2 | R1 | S1 | S2 | S3 |
|---|---|---|---|---|---|
| 0.7033 | 0.7010 | 0.6996 | 0.6958 | 0.6935 | 0.6921 |
End-of-day snapshot for AUD/USD: closing at 0.6955 (-0.38% on the day), at the 62th percentile of its 0.6421–0.7277 52-week range. Today's full-session range of 0.6950–0.7013 (0.0062 points). The daily close below the pivot (0.6972) signals bearish momentum into tomorrow's Asian open.
For tomorrow's Asian open, the key pivot reference levels remain: R1 0.6996 / R2 0.7010 / R3 0.7033 on the upside and S1 0.6958 / S2 0.6935 / S3 0.6921 on the downside. Asian session liquidity is typically thinner, so gaps through pivot levels should be monitored carefully.
AUD/USD finishes the day the pair is closing in the upper half of its annual range, a constructive sign for bulls. The 52-week range of 0.6421–0.7277 places the pair at the 62th percentile. Key overnight risk: Asian economic data and any after-hours US developments that could reprice the USD complex before London re-opens.
AUD/USDBearishBelow S1
NZD/USD
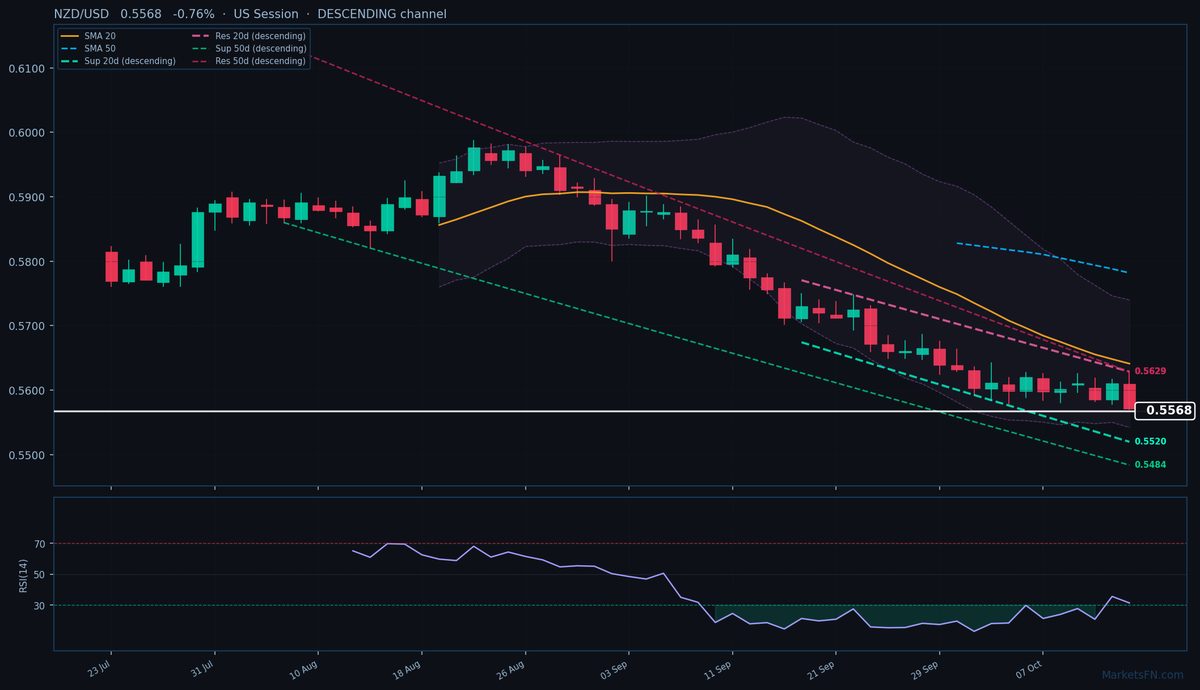
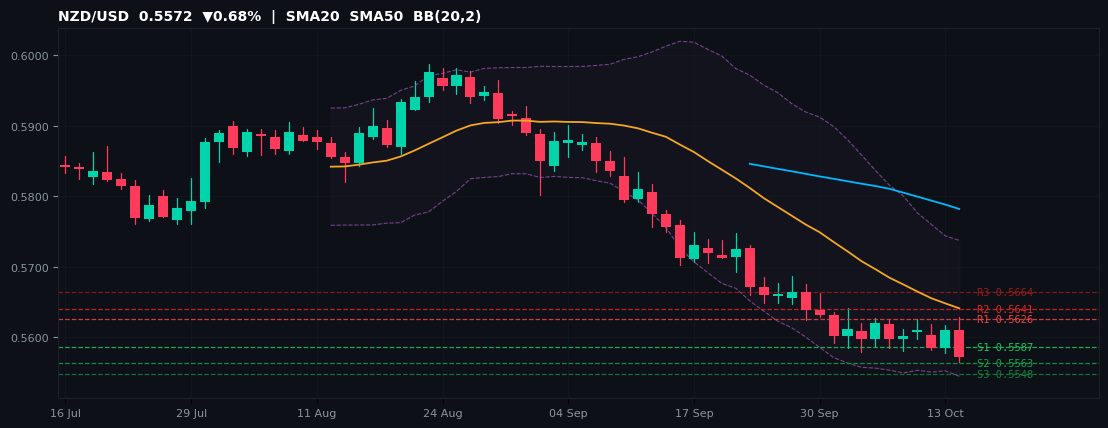
0.5572 ▼0.68% Day H 0.5629 / L 0.5564 52W 0.5564–0.6092
| R3 | R2 | R1 | S1 | S2 | S3 |
|---|---|---|---|---|---|
| 0.5664 | 0.5641 | 0.5626 | 0.5587 | 0.5563 | 0.5548 |
End-of-day snapshot for NZD/USD: closing at 0.5572 (-0.68% on the day), just 0.14% above its 52-week floor at 0.5564. Today's full-session range of 0.5564–0.5629 (0.0064 points). The daily close below the pivot (0.5602) signals bearish momentum into tomorrow's Asian open.
For tomorrow's Asian open, the key pivot reference levels remain: R1 0.5626 / R2 0.5641 / R3 0.5664 on the upside and S1 0.5587 / S2 0.5563 / S3 0.5548 on the downside. Asian session liquidity is typically thinner, so gaps through pivot levels should be monitored carefully.
NZD/USD finishes the day the annual support is under watch — a close below would reset the technical outlook bearish. The 52-week range of 0.5564–0.6092 places the pair at the 2th percentile. Key overnight risk: Asian economic data and any after-hours US developments that could reprice the USD complex before London re-opens.
NZD/USDBearishBelow S1Near 52W Low
USD/CAD
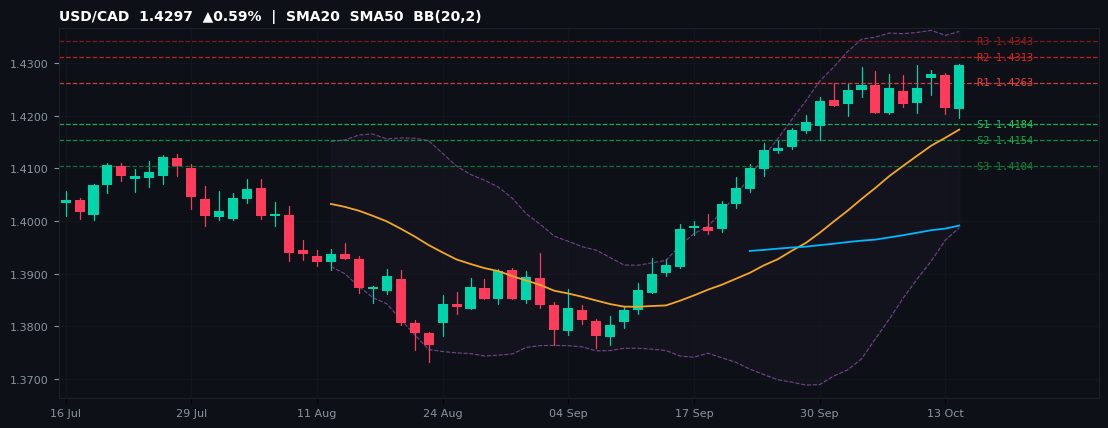
1.4297 ▲0.59% Day H 1.4298 / L 1.4196 52W 1.3480–1.4298
| R3 | R2 | R1 | S1 | S2 | S3 |
|---|---|---|---|---|---|
| 1.4343 | 1.4313 | 1.4263 | 1.4184 | 1.4154 | 1.4104 |
End-of-day snapshot for USD/CAD: closing at 1.4297 (+0.59% on the day), just 0.00% below its 52-week high of 1.4298. Today's full-session range of 1.4196–1.4298 (0.0102 points). The daily close above the pivot (1.4233) signals bullish continuation into tomorrow's Asian open.
For tomorrow's Asian open, the key pivot reference levels remain: R1 1.4263 / R2 1.4313 / R3 1.4343 on the upside and S1 1.4184 / S2 1.4154 / S3 1.4104 on the downside. Asian session liquidity is typically thinner, so gaps through pivot levels should be monitored carefully.
USD/CAD finishes the day the trend is intact; bulls will target a break above the annual high on the next catalyst. The 52-week range of 1.3480–1.4298 places the pair at the 100th percentile. Key overnight risk: Asian economic data and any after-hours US developments that could reprice the USD complex before London re-opens.
USD/CADBullishAbove R1Near 52W High
📚 Book Insights
If You Believe Markets Are Efficient, Do Not Read This
A practitioner's guide to structural market inefficiencies — how central bank policy divergence, carry dynamics, and cross-asset flows create durable FX trading edges that efficient-market theorists systematically underestimate.
Read the analysis →Cross Pairs
EUR/GBP
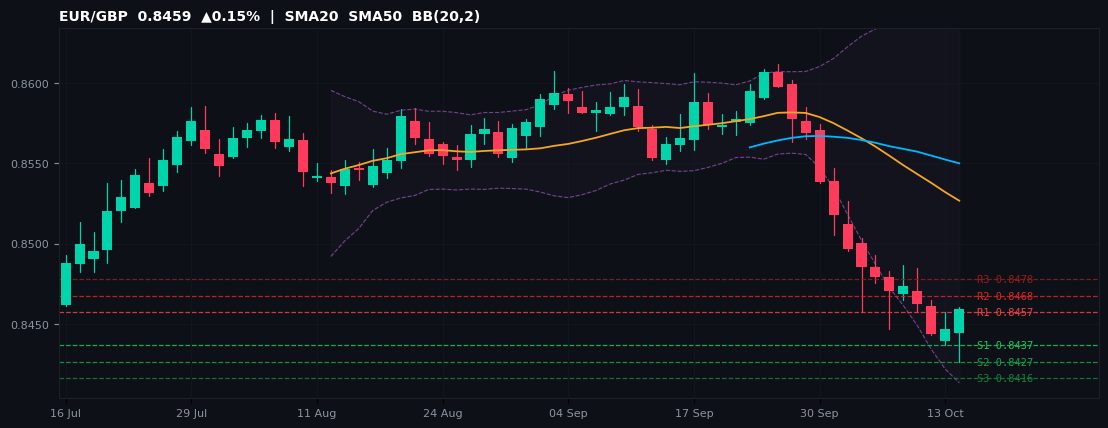
0.8459 ▲0.15% Day H 0.8460 / L 0.8426 52W 0.8426–0.8865
| R3 | R2 | R1 | S1 | S2 | S3 |
|---|---|---|---|---|---|
| 0.8478 | 0.8468 | 0.8457 | 0.8437 | 0.8427 | 0.8416 |
End-of-day snapshot for EUR/GBP: closing at 0.8459 (+0.15% on the day), just 0.40% above its 52-week floor at 0.8426. Today's full-session range of 0.8426–0.8460 (0.0034 points). The daily close above the pivot (0.8447) signals bullish continuation into tomorrow's Asian open.
For tomorrow's Asian open, the key pivot reference levels remain: R1 0.8457 / R2 0.8468 / R3 0.8478 on the upside and S1 0.8437 / S2 0.8427 / S3 0.8416 on the downside. Asian session liquidity is typically thinner, so gaps through pivot levels should be monitored carefully.
EUR/GBP finishes the day the annual support is under watch — a close below would reset the technical outlook bearish. The 52-week range of 0.8426–0.8865 places the pair at the 8th percentile. Key overnight risk: Asian economic data and any after-hours US developments that could reprice the USD complex before London re-opens.
EUR/GBPRangeboundAbove R1Near 52W Low
EUR/JPY
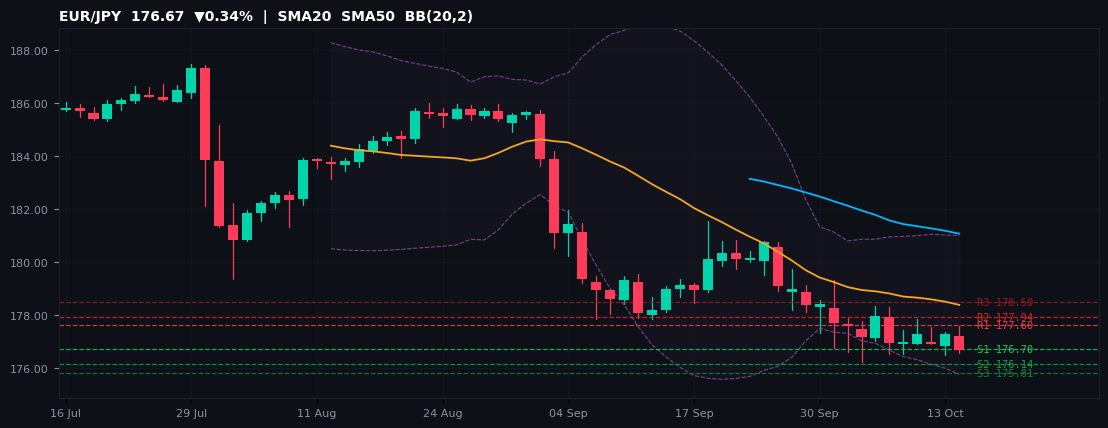
176.67 ▼0.34% Day H 177.58 / L 176.57 52W 175.70–187.94
| R3 | R2 | R1 | S1 | S2 | S3 |
|---|---|---|---|---|---|
| 178.50 | 177.94 | 177.60 | 176.70 | 176.14 | 175.81 |
End-of-day snapshot for EUR/JPY: closing at 176.67 (-0.34% on the day), just 0.56% above its 52-week floor at 175.70. Today's full-session range of 176.57–177.58 (1.01 points). The daily close below the pivot (177.04) signals bearish momentum into tomorrow's Asian open.
For tomorrow's Asian open, the key pivot reference levels remain: R1 177.60 / R2 177.94 / R3 178.50 on the upside and S1 176.70 / S2 176.14 / S3 175.81 on the downside. Asian session liquidity is typically thinner, so gaps through pivot levels should be monitored carefully.
EUR/JPY finishes the day the annual support is under watch — a close below would reset the technical outlook bearish. The 52-week range of 175.70–187.94 places the pair at the 8th percentile. Key overnight risk: Asian economic data and any after-hours US developments that could reprice the USD complex before London re-opens.
EUR/JPYBearishBelow S1Near 52W Low
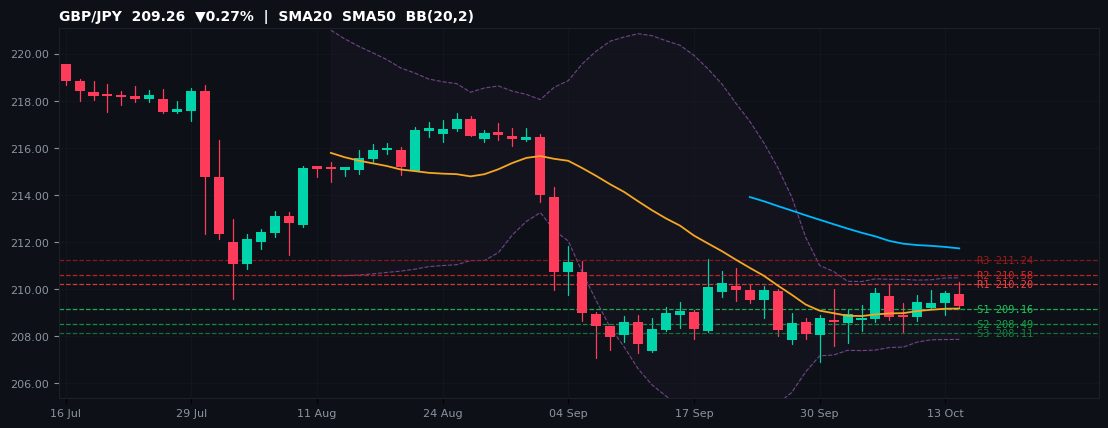
GBP/JPY
209.26 ▼0.27% Day H 210.30 / L 209.24 52W 199.06–219.60
| R3 | R2 | R1 | S1 | S2 | S3 |
|---|---|---|---|---|---|
| 211.24 | 210.58 | 210.20 | 209.16 | 208.49 | 208.11 |
End-of-day snapshot for GBP/JPY: closing at 209.26 (-0.27% on the day), at the 50th percentile of its 199.06–219.60 52-week range. Today's full-session range of 209.24–210.30 (1.06 points). The daily close below the pivot (209.54) signals bearish momentum into tomorrow's Asian open.
For tomorrow's Asian open, the key pivot reference levels remain: R1 210.20 / R2 210.58 / R3 211.24 on the upside and S1 209.16 / S2 208.49 / S3 208.11 on the downside. Asian session liquidity is typically thinner, so gaps through pivot levels should be monitored carefully.
GBP/JPY finishes the day the pair is ending the day in the lower half of its annual range, keeping bears in control. The 52-week range of 199.06–219.60 places the pair at the 50th percentile. Key overnight risk: Asian economic data and any after-hours US developments that could reprice the USD complex before London re-opens.
GBP/JPYRangebound
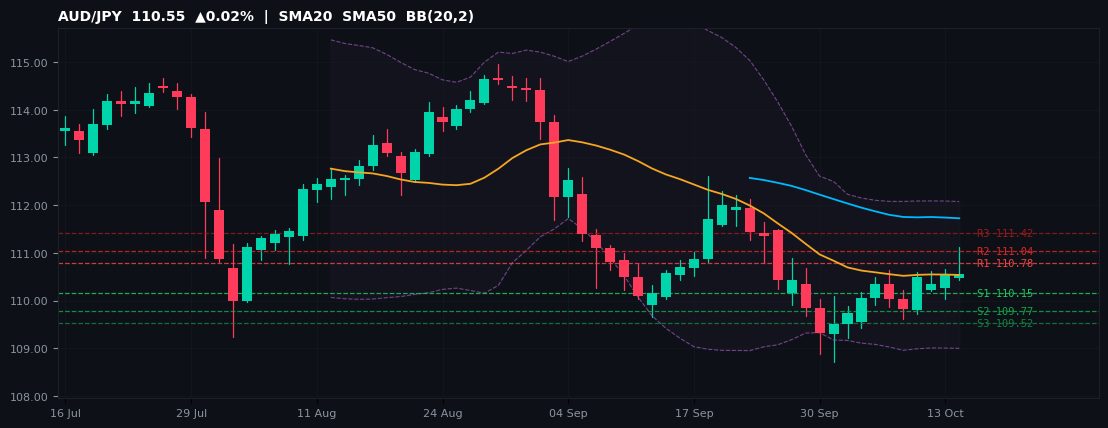
AUD/JPY
110.55 ▲0.02% Day H 111.12 / L 110.42 52W 98.82–114.95
| R3 | R2 | R1 | S1 | S2 | S3 |
|---|---|---|---|---|---|
| 111.42 | 111.04 | 110.78 | 110.15 | 109.77 | 109.52 |
End-of-day snapshot for AUD/JPY: closing at 110.55 (+0.02% on the day), at the 73th percentile of its 98.82–114.95 52-week range. Today's full-session range of 110.42–111.12 (0.70 points). The daily close above the pivot (110.40) signals bullish continuation into tomorrow's Asian open.
For tomorrow's Asian open, the key pivot reference levels remain: R1 110.78 / R2 111.04 / R3 111.42 on the upside and S1 110.15 / S2 109.77 / S3 109.52 on the downside. Asian session liquidity is typically thinner, so gaps through pivot levels should be monitored carefully.
AUD/JPY finishes the day the pair is closing in the upper half of its annual range, a constructive sign for bulls. The 52-week range of 98.82–114.95 places the pair at the 73th percentile. Key overnight risk: Asian economic data and any after-hours US developments that could reprice the USD complex before London re-opens.
AUD/JPYRangebound
🏭 Forex Course — Quick Quiz
Test Your Knowledge on Today's Key Themes
Five questions on carry trade dynamics, central bank divergence, commodity-currency correlations and technical extremes. Instant results, mobile-friendly.
Start the Quiz →Nordic Pairs
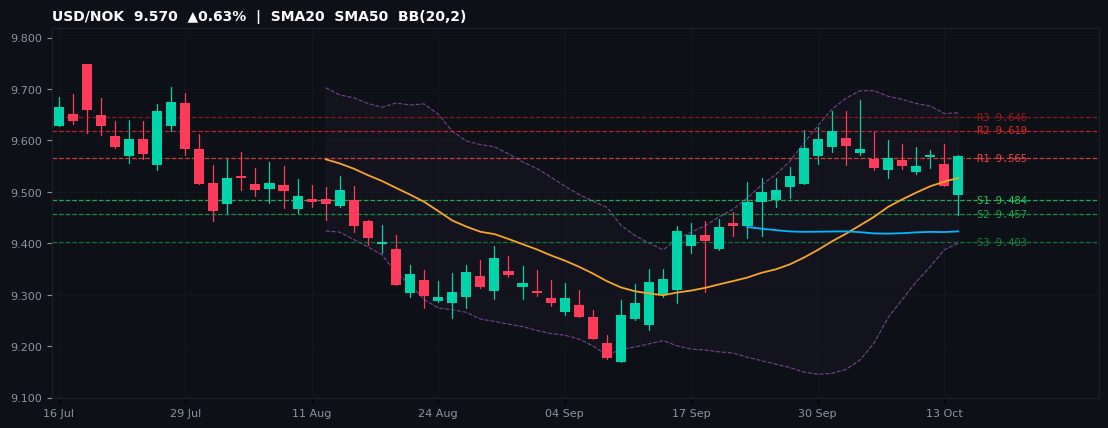
USD/NOK
9.570 ▲0.63% Day H 9.572 / L 9.455 52W 9.144–10.297
| R3 | R2 | R1 | S1 | S2 | S3 |
|---|---|---|---|---|---|
| 9.646 | 9.619 | 9.565 | 9.484 | 9.457 | 9.403 |
End-of-day snapshot for USD/NOK: closing at 9.570 (+0.63% on the day), at the 37th percentile of its 9.144–10.297 52-week range. Today's full-session range of 9.455–9.572 (0.117 points). The daily close above the pivot (9.538) signals bullish continuation into tomorrow's Asian open.
For tomorrow's Asian open, the key pivot reference levels remain: R1 9.565 / R2 9.619 / R3 9.646 on the upside and S1 9.484 / S2 9.457 / S3 9.403 on the downside. Asian session liquidity is typically thinner, so gaps through pivot levels should be monitored carefully.
USD/NOK finishes the day the pair is ending the day in the lower half of its annual range, keeping bears in control. The 52-week range of 9.144–10.297 places the pair at the 37th percentile. Key overnight risk: Asian economic data and any after-hours US developments that could reprice the USD complex before London re-opens.
USD/NOKBullishAbove R1
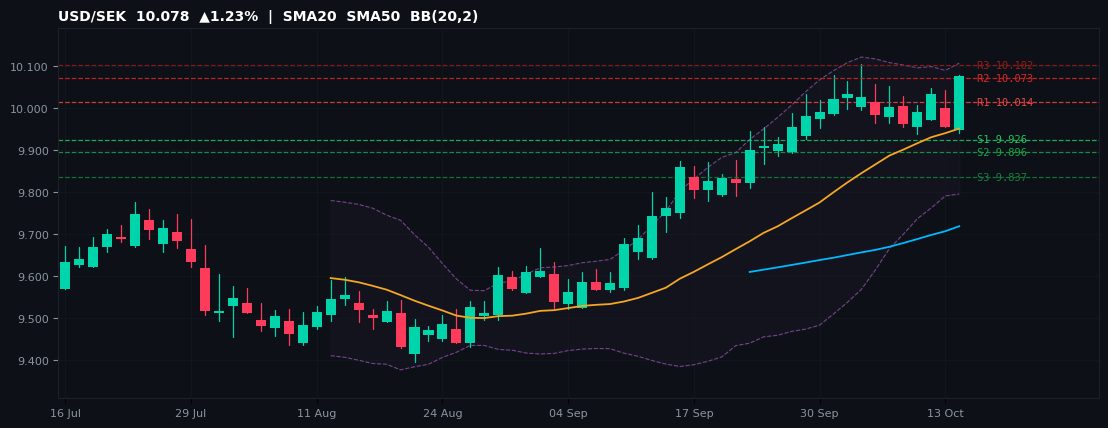
USD/SEK
10.078 ▲1.23% Day H 10.080 / L 9.942 52W 8.737–10.105
| R3 | R2 | R1 | S1 | S2 | S3 |
|---|---|---|---|---|---|
| 10.102 | 10.073 | 10.014 | 9.926 | 9.896 | 9.837 |
End-of-day snapshot for USD/SEK: closing at 10.078 (+1.23% on the day), just 0.27% below its 52-week high of 10.105. Today's full-session range of 9.942–10.080 (0.138 points). The daily close above the pivot (9.985) signals bullish continuation into tomorrow's Asian open.
For tomorrow's Asian open, the key pivot reference levels remain: R1 10.014 / R2 10.073 / R3 10.102 on the upside and S1 9.926 / S2 9.896 / S3 9.837 on the downside. Asian session liquidity is typically thinner, so gaps through pivot levels should be monitored carefully.
USD/SEK finishes the day the trend is intact; bulls will target a break above the annual high on the next catalyst. The 52-week range of 8.737–10.105 places the pair at the 98th percentile. Key overnight risk: Asian economic data and any after-hours US developments that could reprice the USD complex before London re-opens.
USD/SEKBullishAbove R1Near 52W High
EUR/NOK
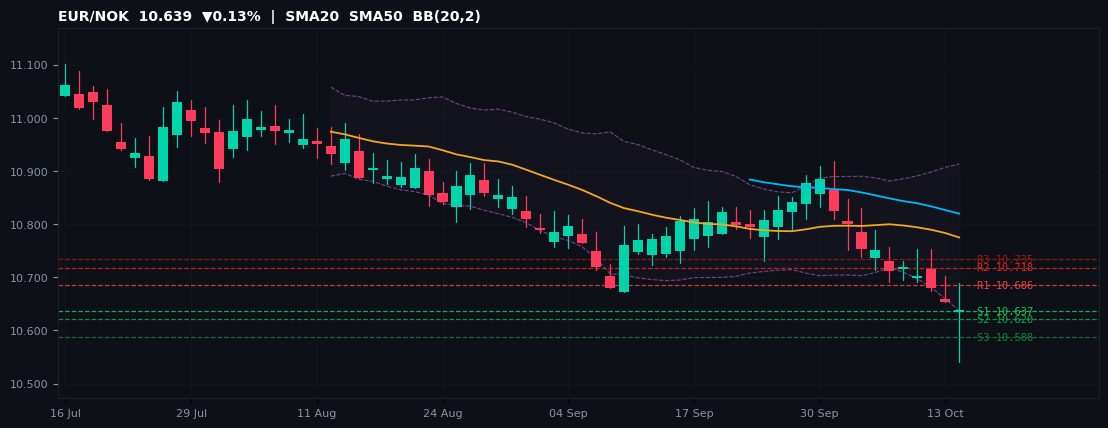
10.639 ▼0.13% Day H 10.689 / L 10.540 52W 10.540–12.012
| R3 | R2 | R1 | S1 | S2 | S3 |
|---|---|---|---|---|---|
| 10.735 | 10.718 | 10.686 | 10.637 | 10.620 | 10.588 |
End-of-day snapshot for EUR/NOK: closing at 10.639 (-0.13% on the day), just 0.94% above its 52-week floor at 10.540. Today's full-session range of 10.540–10.689 (0.149 points). The daily close below the pivot (10.669) signals bearish momentum into tomorrow's Asian open.
For tomorrow's Asian open, the key pivot reference levels remain: R1 10.686 / R2 10.718 / R3 10.735 on the upside and S1 10.637 / S2 10.620 / S3 10.588 on the downside. Asian session liquidity is typically thinner, so gaps through pivot levels should be monitored carefully.
EUR/NOK finishes the day the annual support is under watch — a close below would reset the technical outlook bearish. The 52-week range of 10.540–12.012 places the pair at the 7th percentile. Key overnight risk: Asian economic data and any after-hours US developments that could reprice the USD complex before London re-opens.
EUR/NOKRangeboundNear 52W Low
NOK/SEK
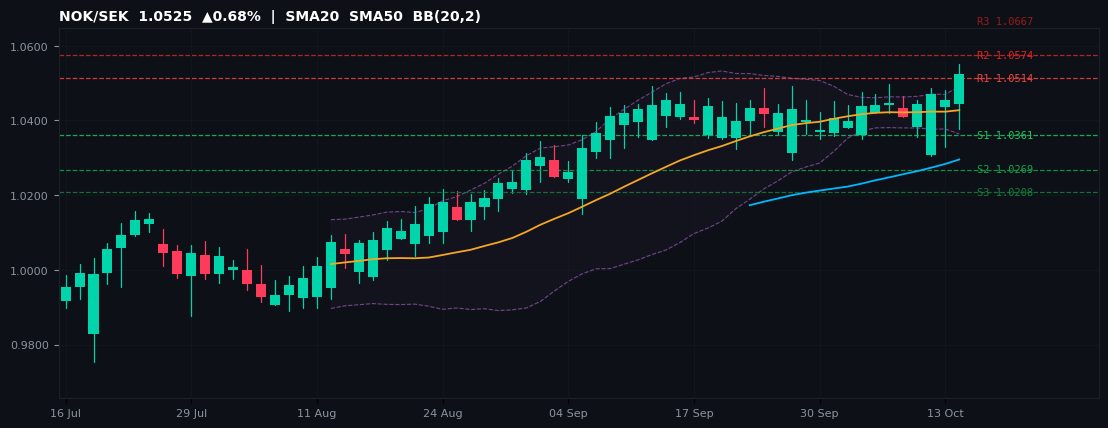
1.0525 ▲0.68% Day H 1.0550 / L 1.0377 52W 0.9064–1.0550
| R3 | R2 | R1 | S1 | S2 | S3 |
|---|---|---|---|---|---|
| 1.0667 | 1.0574 | 1.0514 | 1.0361 | 1.0269 | 1.0208 |
End-of-day snapshot for NOK/SEK: closing at 1.0525 (+0.68% on the day), just 0.24% below its 52-week high of 1.0550. Today's full-session range of 1.0377–1.0550 (0.0173 points). The daily close above the pivot (1.0421) signals bullish continuation into tomorrow's Asian open.
For tomorrow's Asian open, the key pivot reference levels remain: R1 1.0514 / R2 1.0574 / R3 1.0667 on the upside and S1 1.0361 / S2 1.0269 / S3 1.0208 on the downside. Asian session liquidity is typically thinner, so gaps through pivot levels should be monitored carefully.
NOK/SEK finishes the day the trend is intact; bulls will target a break above the annual high on the next catalyst. The 52-week range of 0.9064–1.0550 places the pair at the 98th percentile. Key overnight risk: Asian economic data and any after-hours US developments that could reprice the USD complex before London re-opens.
NOK/SEKBullishAbove R1Near 52W High
Exotic Pairs
USD/TRY
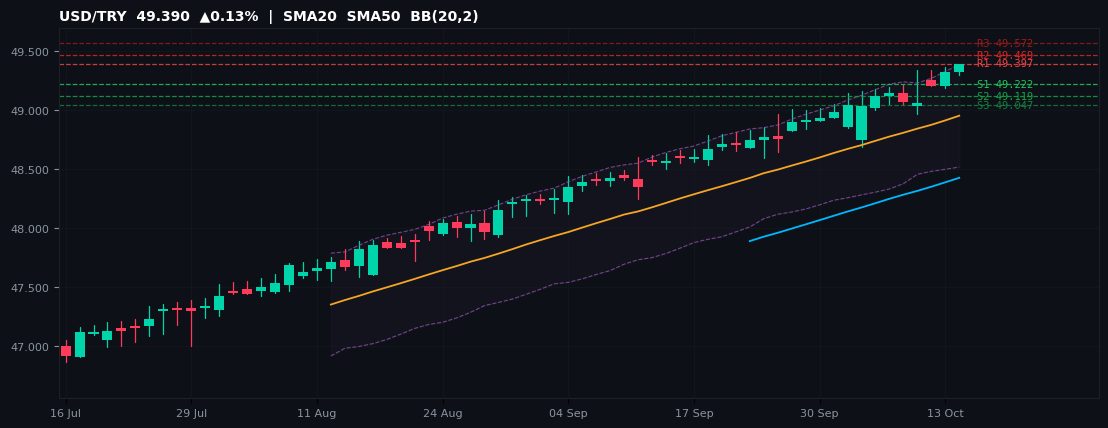
49.390 ▲0.13% Day H 49.391 / L 49.298 52W 41.648–49.391
| R3 | R2 | R1 | S1 | S2 | S3 |
|---|---|---|---|---|---|
| 49.572 | 49.469 | 49.397 | 49.222 | 49.119 | 49.047 |
End-of-day snapshot for USD/TRY: closing at 49.390 (+0.13% on the day), just 0.00% below its 52-week high of 49.391. Today's full-session range of 49.298–49.391 (0.093 points). The daily close above the pivot (49.294) signals bullish continuation into tomorrow's Asian open.
For tomorrow's Asian open, the key pivot reference levels remain: R1 49.397 / R2 49.469 / R3 49.572 on the upside and S1 49.222 / S2 49.119 / S3 49.047 on the downside. Asian session liquidity is typically thinner, so gaps through pivot levels should be monitored carefully.
USD/TRY finishes the day the trend is intact; bulls will target a break above the annual high on the next catalyst. The 52-week range of 41.648–49.391 places the pair at the 100th percentile. Key overnight risk: Asian economic data and any after-hours US developments that could reprice the USD complex before London re-opens.
USD/TRYRangeboundNear 52W High
USD/MXN
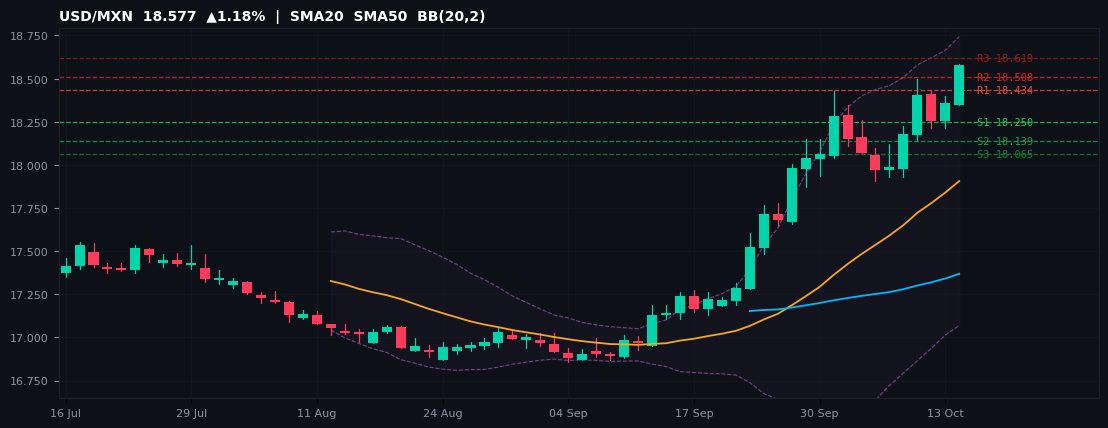
18.577 ▲1.18% Day H 18.583 / L 18.347 52W 16.855–18.768
| R3 | R2 | R1 | S1 | S2 | S3 |
|---|---|---|---|---|---|
| 18.619 | 18.508 | 18.434 | 18.250 | 18.139 | 18.065 |
End-of-day snapshot for USD/MXN: closing at 18.577 (+1.18% on the day), just 1.03% below its 52-week high of 18.768. Today's full-session range of 18.347–18.583 (0.236 points). The daily close above the pivot (18.323) signals bullish continuation into tomorrow's Asian open.
For tomorrow's Asian open, the key pivot reference levels remain: R1 18.434 / R2 18.508 / R3 18.619 on the upside and S1 18.250 / S2 18.139 / S3 18.065 on the downside. Asian session liquidity is typically thinner, so gaps through pivot levels should be monitored carefully.
USD/MXN finishes the day the trend is intact; bulls will target a break above the annual high on the next catalyst. The 52-week range of 16.855–18.768 places the pair at the 90th percentile. Key overnight risk: Asian economic data and any after-hours US developments that could reprice the USD complex before London re-opens.
USD/MXNBullishAbove R1Near 52W High
USD/ZAR
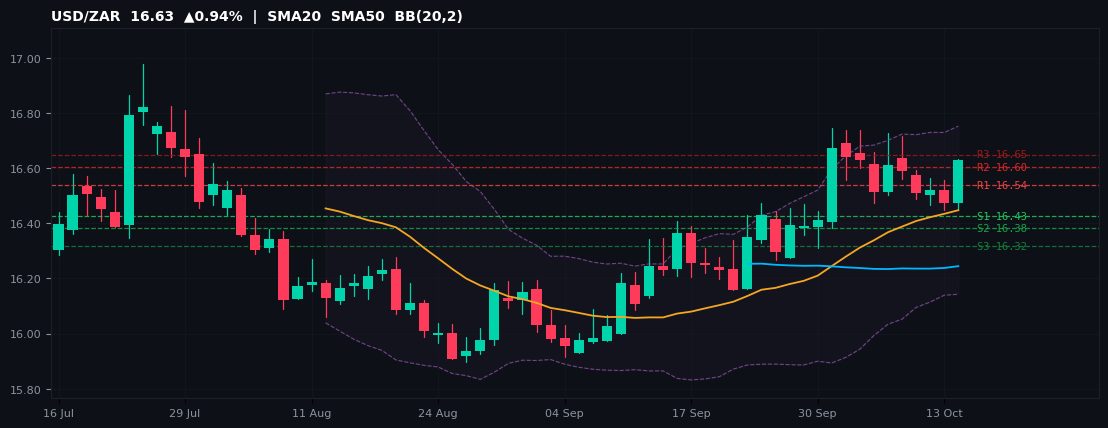
16.63 ▲0.94% Day H 16.63 / L 16.45 52W 15.64–17.57
| R3 | R2 | R1 | S1 | S2 | S3 |
|---|---|---|---|---|---|
| 16.65 | 16.60 | 16.54 | 16.43 | 16.38 | 16.32 |
End-of-day snapshot for USD/ZAR: closing at 16.63 (+0.94% on the day), at the 51th percentile of its 15.64–17.57 52-week range. Today's full-session range of 16.45–16.63 (0.19 points). The daily close above the pivot (16.49) signals bullish continuation into tomorrow's Asian open.
For tomorrow's Asian open, the key pivot reference levels remain: R1 16.54 / R2 16.60 / R3 16.65 on the upside and S1 16.43 / S2 16.38 / S3 16.32 on the downside. Asian session liquidity is typically thinner, so gaps through pivot levels should be monitored carefully.
USD/ZAR finishes the day the pair is closing in the upper half of its annual range, a constructive sign for bulls. The 52-week range of 15.64–17.57 places the pair at the 51th percentile. Key overnight risk: Asian economic data and any after-hours US developments that could reprice the USD complex before London re-opens.
USD/ZARBullishAbove R1
USD/PLN
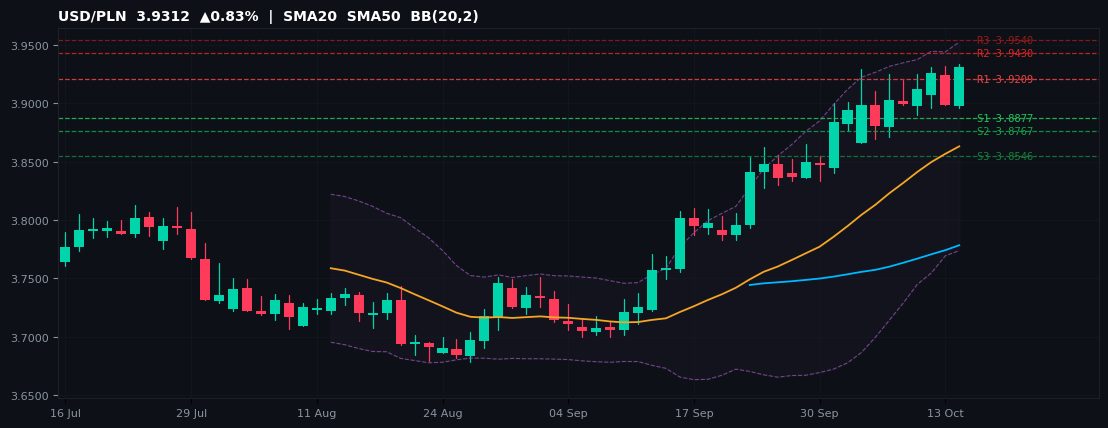
3.9312 ▲0.83% Day H 3.9335 / L 3.8957 52W 3.4750–3.9335
| R3 | R2 | R1 | S1 | S2 | S3 |
|---|---|---|---|---|---|
| 3.9540 | 3.9430 | 3.9209 | 3.8877 | 3.8767 | 3.8546 |
End-of-day snapshot for USD/PLN: closing at 3.9312 (+0.83% on the day), just 0.06% below its 52-week high of 3.9335. Today's full-session range of 3.8957–3.9335 (0.0379 points). The daily close above the pivot (3.9098) signals bullish continuation into tomorrow's Asian open.
For tomorrow's Asian open, the key pivot reference levels remain: R1 3.9209 / R2 3.9430 / R3 3.9540 on the upside and S1 3.8877 / S2 3.8767 / S3 3.8546 on the downside. Asian session liquidity is typically thinner, so gaps through pivot levels should be monitored carefully.
USD/PLN finishes the day the trend is intact; bulls will target a break above the annual high on the next catalyst. The 52-week range of 3.4750–3.9335 places the pair at the 99th percentile. Key overnight risk: Asian economic data and any after-hours US developments that could reprice the USD complex before London re-opens.
USD/PLNBullishAbove R1Near 52W High
Informational purposes only — not investment advice. Pivot levels computed from yesterday's session OHLC via standard floor-pivot formula. Prices sourced from MetaTrader 5 as of Wednesday 14 October 2026 evening (20:30 CET). Past performance is not indicative of future results.