USD/MXN: Down 0.05% to 18.0521 — RSI Overbought
MarketsFN Team
USD/MXN: Down 0.05% to 18.0521 — RSI Overbought
Published: October 07, 2026 · MarketsFN Team · US Session · Emerging FX
| Pair | Rate | Change | RSI(14) | SMA-20 | SMA-50 | 52W High | 52W Low | Pivot | R1 | S1 |
|---|---|---|---|---|---|---|---|---|---|---|
| USD/MXN | 18.0521 | -0.05% | 76.8 | 17.5481 | 17.2575 | 18.6755 | 16.8855 | 18.0224 | 18.1383 | 17.9456 |
S/R Support & Resistance Levels
Dynamic Trendlines
| Level | Type | Direction | Distance |
|---|---|---|---|
| 17.9450 | 20d Support | up (ascending) | -0.59% / 1070.8 pips |
| 18.8170 | 20d Resistance | up (ascending) | +4.24% / 7649.3 pips |
| 16.9846 | 50d Support | up (ascending) | -5.91% / 10674.5 pips |
| 18.5080 | 50d Resistance | up (ascending) | +2.53% / 4558.7 pips |
Static Levels
| Level | Type | Touches | Distance |
|---|---|---|---|
| 17.3622 | Support | 2x | -3.82% / 6899.3 pips |
| 17.1475 | Support | 2x | -5.01% / 9046.3 pips |
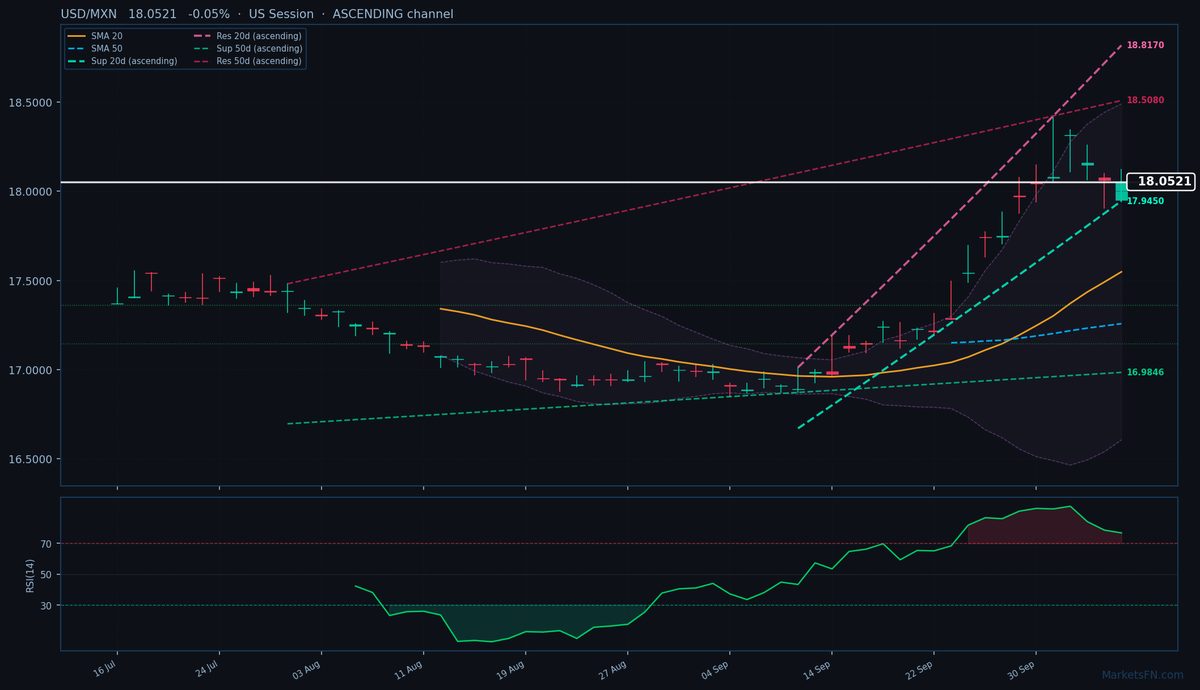
USD/MXN is trading at 18.0521 (-0.05%), consolidating near the top of its 52-week range (16.8855 – 18.6755) after testing the upper bound of its 20-day ascending channel. The pair remains firmly in an uptrend, trading above both the 20-day SMA (17.5481) and 50-day SMA (17.2575), with the 20-day dynamic resistance trendline at 18.8170 (+4.24%, 7649.3 pips away) and support at 17.9450 (-0.59%, 1070.8 pips away). The 50-day channel is also ascending, with resistance at 18.5080 (+2.53%, 4558.7 pips away) and support far below at 16.9846 (-5.91%, 10674.5 pips away).
Static levels show immediate support at S1 (17.9456, -106.5 pips), which aligns with today’s low (17.9450), while R1 (18.1383, +86.2 pips) sits just above the day’s high (18.1215). The RSI(14) at 76.8 signals overbought conditions, suggesting potential near-term exhaustion, though the ascending channel and SMA positioning favor continuation. With the ATR(14) at 0.2347, volatility remains elevated, and a break above R1 could target the 52-week high (18.6755).
Short-term, the pair is at a crossroads: either consolidates below R1 to relieve overbought pressure or breaks higher on renewed dollar strength. Watch for a close above 18.1215 to confirm bullish continuation, while a drop below 17.9450 could trigger profit-taking toward the 20-day SMA (17.5481). The European session’s price action will be key — a failure to hold above 18.0224 (pivot) may signal near-term weakness.
Disclaimer
The content on MarketsFN.com is provided for educational and informational purposes only and does not constitute financial advice. All investments involve risk and past performance does not guarantee future results.