USD/THB: Up 0.03% to 33.7000 — Ascending Channel
MarketsFN Team
USD/THB: Up 0.03% to 33.7000 — Ascending Channel
Published: October 07, 2026 · MarketsFN Team · US Session · Emerging FX
| Pair | Rate | Change | RSI(14) | SMA-20 | SMA-50 | 52W High | 52W Low | Pivot | R1 | S1 |
|---|---|---|---|---|---|---|---|---|---|---|
| USD/THB | 33.7000 | +0.03% | 60.4 | 33.3837 | 33.1725 | 33.8300 | 30.9100 | 33.6467 | 33.7433 | 33.5933 |
S/R Support & Resistance Levels
Dynamic Trendlines
| Level | Type | Direction | Distance |
|---|---|---|---|
| 33.4516 | 20d Support | up (ascending) | -0.74% / 2484.5 pips |
| 33.8446 | 20d Resistance | up (ascending) | +0.43% / 1446.1 pips |
| 33.2026 | 50d Support | up (ascending) | -1.48% / 4974.3 pips |
| 33.7397 | 50d Resistance | flat (flat) | +0.12% / 397.1 pips |
Static Levels
| Level | Type | Touches | Distance |
|---|---|---|---|
| 32.3965 | Support | 2x | -3.87% / 13035.0 pips |
| 30.9500 | Support | 2x | -8.16% / 27500.0 pips |
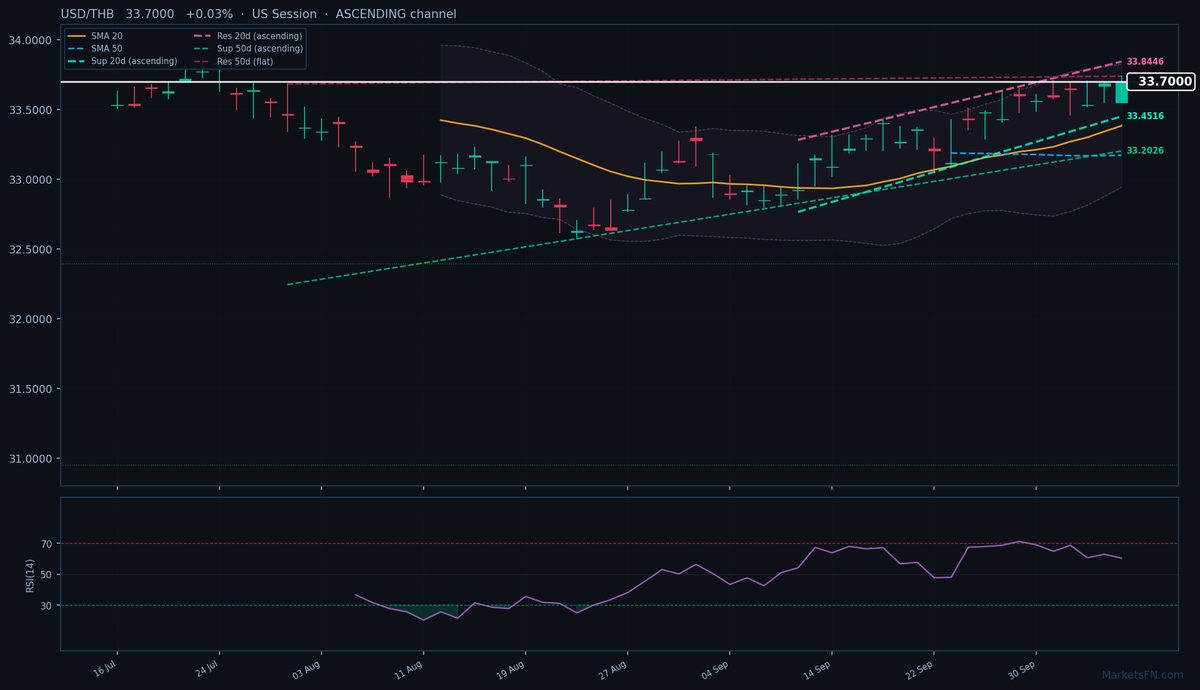
USD/THB is trading at 33.7000 (+0.03%), consolidating near the upper bounds of its 52-week range (30.9100–33.8300) as the pair maintains a firm uptrend. The rate sits comfortably above both the 20-day (33.3837) and 50-day (33.1725) SMAs, confirming bullish momentum. Price action remains within an ascending 20-day dynamic channel, with immediate support at 33.4516 (2484.5 pips below) and resistance at 33.8446 (1446.1 pips above). The 50-day channel also trends upward, though its resistance at 33.7397 is nearly flat and just 397.1 pips away — a potential near-term ceiling.
Static levels show the closest pivot resistance (R1) at 33.7433, only 433 pips above current levels, while support (S1) sits at 33.5933 (1067 pips below). The RSI at 60.4 suggests neutral momentum, neither overbought nor oversold, leaving room for further upside if dollar strength persists. With the pair testing the upper half of today’s range (33.5500–33.7400) and the 52-week high at 33.8300 within striking distance, a breakout above 33.7400 could trigger a test of the record high. However, failure to hold above the 20-day SMA (33.3837) would signal a potential pullback. The key near-term catalyst is whether USD/THB can breach the 50-day dynamic resistance at 33.7397 — a clean break would confirm the uptrend’s durability.
Disclaimer
The content on MarketsFN.com is provided for educational and informational purposes only and does not constitute financial advice. All investments involve risk and past performance does not guarantee future results.