USD/JPY: Up 0.32% to 154.84 — Bearish — Price Below Key MAs
MarketsFN Team
USD/JPY: Up 0.32% to 154.84 — Bearish — Price Below Key MAs
Published: September 15, 2026 · MarketsFN Team
| Pair | Rate | Change | RSI(14) | SMA-20 | SMA-50 | 52W High | 52W Low | Pivot | R1 | S1 |
|---|---|---|---|---|---|---|---|---|---|---|
| USD/JPY | 154.84 | +0.32% | 33.1 | 157.35 | 159.55 | 163.86 | 153.42 | 153.93 | 154.48 | 152.87 |
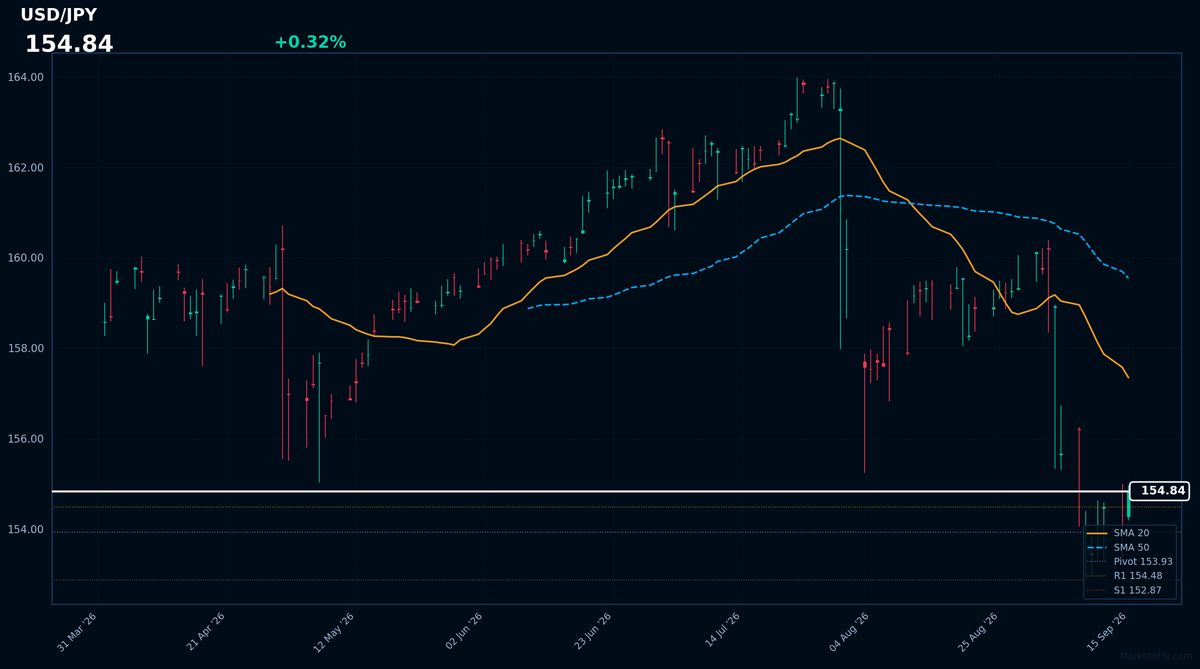
USD/JPY is trading at 154.84 (+0.32%) as of September 15, 2026, during the European session, with a daily range of 154.20 – 154.95. The pair's current level is below both its 20-day and 50-day simple moving averages, at 157.35 and 159.55 respectively, indicating an ongoing downtrend. The relative strength index (RSI) stands at 33.1, still within neutral territory, suggesting that while the pair is not oversold, it is approaching that threshold.
The average true range (ATR) over the last 14 days is 1.79, indicating moderate daily volatility. The current price action is near the first resistance level (R1) at 154.48, having just surpassed it, and is still above the pivot point at 153.93. The first support level (S1) is at 152.87, a level that could be tested if selling pressure intensifies.
The market may be underpricing the potential for further downside given the established downtrend and proximity to oversold conditions. A break below S1 at 152.87 could accelerate selling, potentially targeting the 52-week low of 153.42. The forward catalyst to confirm or invalidate this view is the upcoming US inflation data release, which could significantly impact USD/JPY dynamics by altering expectations for US monetary policy.
Disclaimer
The content on MarketsFN.com is provided for educational and informational purposes only. It does not constitute financial advice or investment recommendations. All investments involve risks and past performance does not guarantee future results. You are solely responsible for your investment decisions.