USD/JPY: Up 0.15% to 160.86 — RSI Overbought
MarketsFN Team
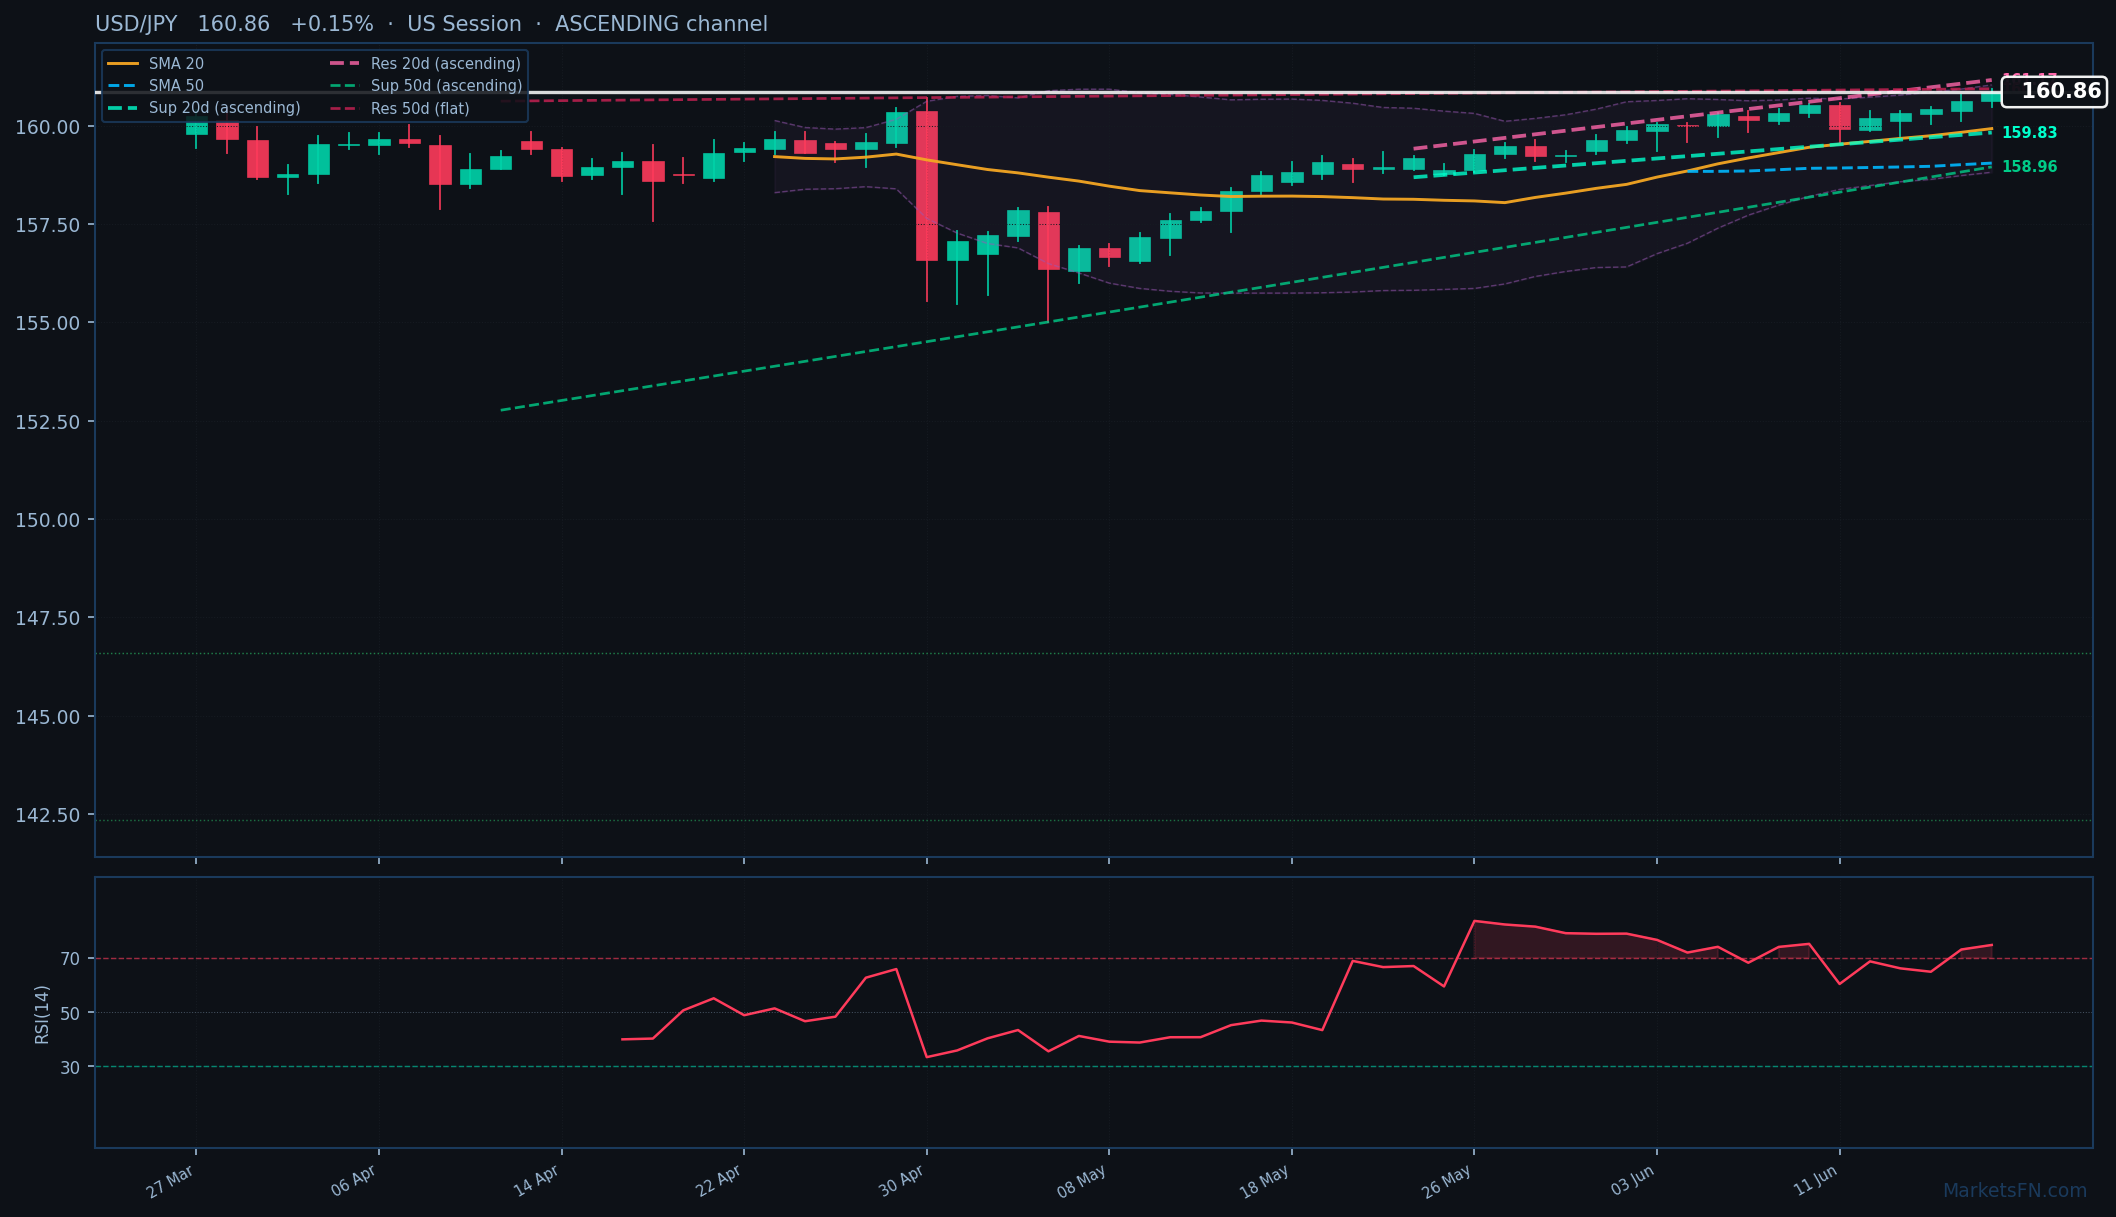
USD/JPY: Up 0.15% to 160.86 — RSI Overbought
Published: June 18, 2026 · MarketsFN Team · US Session
| Pair | Rate | Change | RSI(14) | SMA-20 | SMA-50 | 52W High | 52W Low | Pivot | R1 | S1 |
|---|---|---|---|---|---|---|---|---|---|---|
| USD/JPY | 160.86 | +0.15% | 74.8 | 159.93 | 159.05 | 160.86 | 143.37 | 160.51 | 160.91 | 160.23 |
📊 Support & Resistance Levels
Dynamic Trendlines
| Level | Type | Direction | Distance |
|---|---|---|---|
| 159.83 | 20d Support | ↗ ascending | -0.64% / 103.2 pips |
| 161.17 | 20d Resistance | ↗ ascending | +0.19% / 30.5 pips |
| 158.96 | 50d Support | ↗ ascending | -1.18% / 190.5 pips |
| 160.95 | 50d Resistance | → flat | +0.05% / 8.2 pips |
Static Levels
| Level | Type | Touches | Distance |
|---|---|---|---|
| 146.59 | Support | 3× | -8.87% / 1427.5 pips |
| 142.35 | Support | 2× | -11.51% / 1851.2 pips |
USD/JPY is trading at 160.86 (+0.15%), pressing against its all-time high as the pair extends its relentless uptrend. The price action remains firmly bullish, trading above both the 20-day SMA (159.93) and 50-day SMA (159.05), with the ascending dynamic channels confirming the trend’s strength. The nearest dynamic resistance sits at 161.17, just 30.5 pips above current levels, while dynamic support at 159.83 offers a 103.2-pip buffer below. The 50-day channel shows a steeper ascent, with resistance at 160.95—a mere 8.2 pips away—suggesting immediate upside potential if breached.
Static levels reveal a stark lack of nearby support, with S1 at 160.23 (63 pips below) and R1 at 160.91 (5 pips above), highlighting the market’s vulnerability to abrupt moves. The RSI at 74.8 signals overbought conditions, but in a trending market, this alone isn’t a reversal signal—momentum could sustain further gains before exhaustion. The day’s range (160.47–160.95) aligns with the pivot framework, with a break above 160.95 likely triggering a test of the 161.17 dynamic resistance.
Short-term, the bias remains bullish unless the pair closes below 160.23 (S1), which would signal profit-taking. The key catalyst will be whether USD/JPY can hold above 160.51 (pivot) during the US session—failure here may prompt a pullback toward dynamic support. Until then, the path of least resistance is up.
Disclaimer
The content on MarketsFN.com is provided for educational and informational purposes only and does not constitute financial advice. All investments involve risk and past performance does not guarantee future results.


