USD/JPY: Up 0.13% to 157.59 — RSI Overbought
MarketsFN Team
USD/JPY: Up 0.13% to 157.59 — RSI Overbought
Published: October 01, 2026 · MarketsFN Team · US Session
| Pair | Rate | Change | RSI(14) | SMA-20 | SMA-50 | 52W High | 52W Low | Pivot | R1 | S1 |
|---|---|---|---|---|---|---|---|---|---|---|
| USD/JPY | 157.59 | +0.13% | 76.6 | 156.18 | 158.15 | 163.84 | 150.41 | 157.10 | 157.82 | 156.66 |
📊 Support & Resistance Levels
Dynamic Trendlines
| Level | Type | Direction | Distance |
|---|---|---|---|
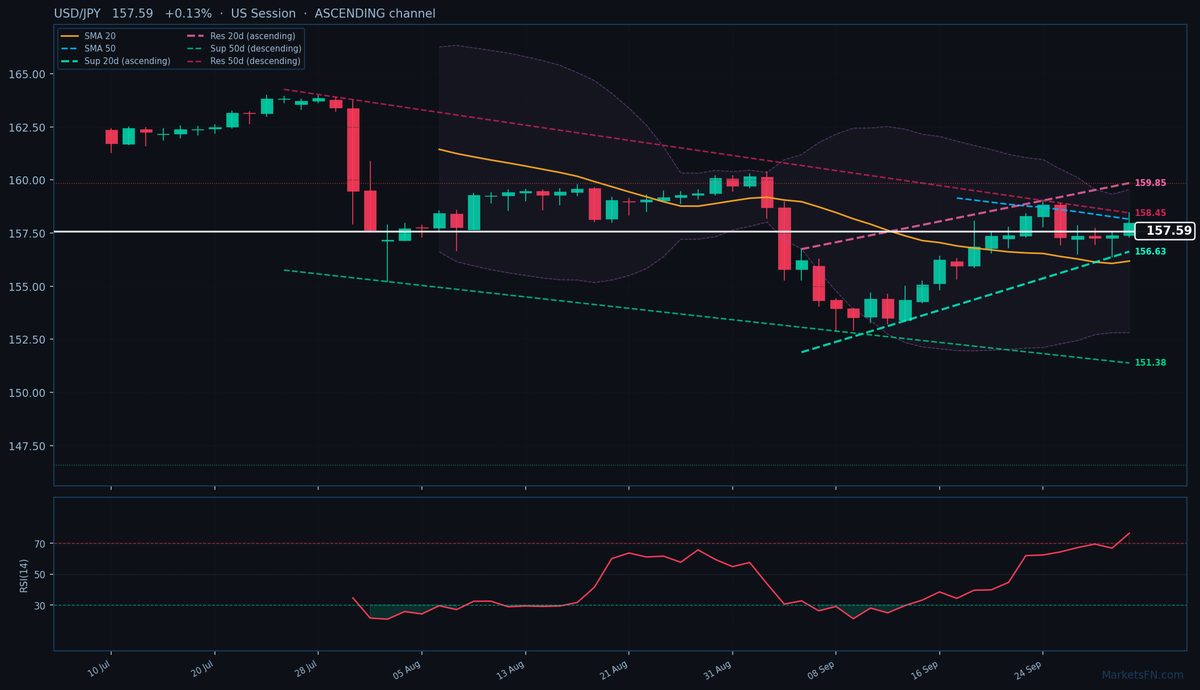
| 156.63 | 20d Support | ↗ ascending | -0.61% / 96.4 pips |
| 159.85 | 20d Resistance | ↗ ascending | +1.44% / 226.2 pips |
| 151.38 | 50d Support | ↘ descending | -3.94% / 621.1 pips |
| 158.45 | 50d Resistance | ↘ descending | +0.54% / 85.5 pips |
Static Levels
| Level | Type | Touches | Distance |
|---|---|---|---|
| 159.85 | Resistance | 2× | +1.18% / 186.4 pips |
| 146.58 | Support | 2× | -7.22% / 1140.6 pips |
USD/JPY is trading at 157.59 (+0.13%), caught in a tug-of-war between short-term bullish momentum and medium-term bearish pressure. The pair is consolidating between its 20-day SMA (156.18, support) and 50-day SMA (158.15, resistance), reflecting indecision after testing the upper bounds of its 20-day ascending channel (dynamic resistance at 159.85, +226.2 pips). Near-term bullish bias is supported by the RSI(14) at 76.6 (overbought but holding), while the descending 50-day channel (dynamic resistance at 158.45, +85.5 pips) warns of broader downside risk.
The 20-day ascending channel (dynamic support at 156.63, -96.4 pips) suggests buyers remain active intraday, but the 50-day descending resistance (158.45) aligns ominously with today’s high. Static levels show weak nearby support (S1 at 146.58 is irrelevant at -1,140.6 pips), leaving the 20-day SMA and dynamic support as critical floors. Meanwhile, R1 at 159.85 (+226.2 pips) is the next meaningful static resistance, though the 50-day dynamic resistance at 158.45 may cap gains first.
Short-term, the pair must break 158.45 to confirm bullish continuation toward 159.85. Failure to hold 156.63 risks a drop to the 20-day SMA (156.18). Watch today’s US session close relative to 157.82 (R1 pivot) — a rejection here would signal exhaustion. The overbought RSI suggests upside is limited unless fundamentals intervene.
Disclaimer
The content on MarketsFN.com is provided for educational and informational purposes only and does not constitute financial advice. All investments involve risk and past performance does not guarantee future results.