GBP/USD: Down 0.47% to 1.3200 — RSI Oversold
MarketsFN Team
GBP/USD: Down 0.47% to 1.3200 — RSI Oversold
Published: October 01, 2026 · MarketsFN Team · US Session
| Pair | Rate | Change | RSI(14) | SMA-20 | SMA-50 | 52W High | 52W Low | Pivot | R1 | S1 |
|---|---|---|---|---|---|---|---|---|---|---|
| GBP/USD | 1.3200 | -0.47% | 20.7 | 1.3382 | 1.3453 | 1.3846 | 1.3019 | 1.3265 | 1.3307 | 1.3219 |
📊 Support & Resistance Levels
Dynamic Trendlines
| Level | Type | Direction | Distance |
|---|---|---|---|
| 1.3105 | 20d Support | ↘ descending | -0.71% / 94.4 pips |
| 1.3291 | 20d Resistance | ↘ descending | +0.70% / 91.8 pips |
| 1.3192 | 50d Support | → flat | -0.06% / 7.5 pips |
| 1.3497 | 50d Resistance | ↘ descending | +2.26% / 297.7 pips |
Static Levels
| Level | Type | Touches | Distance |
|---|---|---|---|
| 1.3567 | Resistance | 2× | +2.55% / 336.7 pips |
| 1.3507 | Resistance | 2× | +2.09% / 276.4 pips |
| 1.3480 | Resistance | 2× | +1.89% / 249.8 pips |
| 1.3177 | Support | 2× | -0.40% / 53.0 pips |
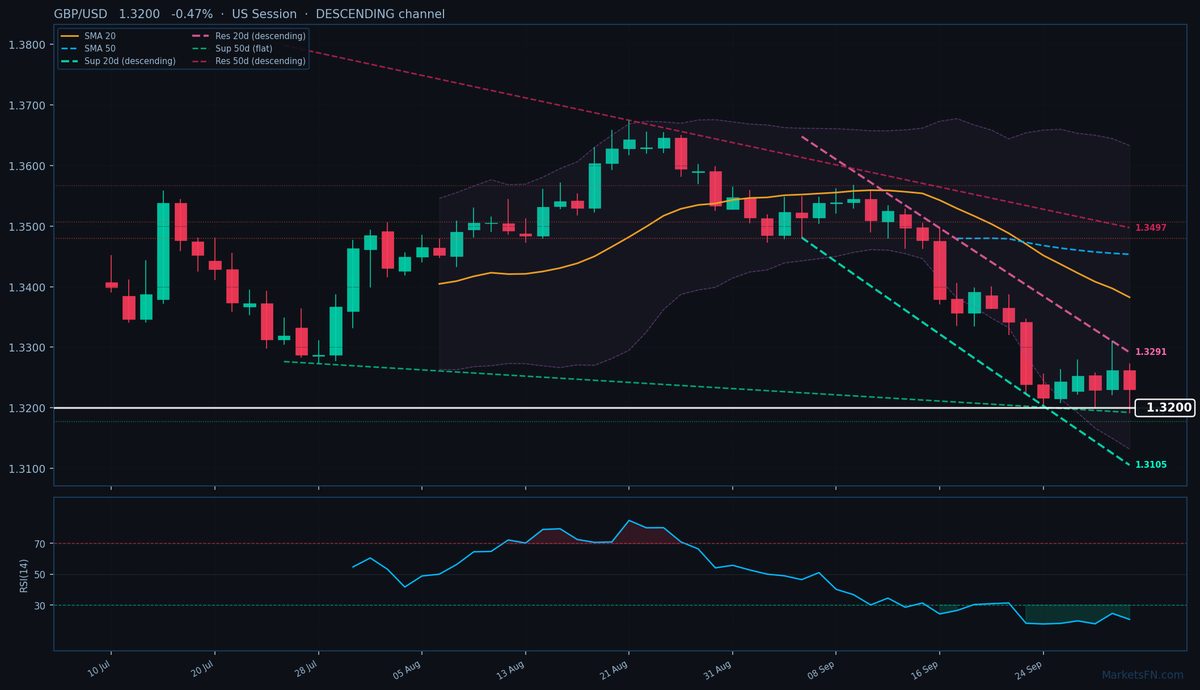
GBP/USD is trading at 1.3200 (-0.47%), extending its downtrend as price action remains firmly below both the 20-day SMA (1.3382) and 50-day SMA (1.3453), confirming bearish momentum. The pair is testing the lower bound of its descending 20-day dynamic channel, with immediate resistance at 1.3291 (91.8 pips above) and support at 1.3105 (94.4 pips below). The 50-day channel is also descending, though flatter, with critical resistance far above at 1.3497 (297.7 pips away) and near-term support just 7.5 pips below at 1.3192 — nearly coinciding with today’s low of 1.3192.
Static levels highlight the bearish structure: S1 at 1.3177 (53.0 pips below) is the nearest support, while R1 at 1.3480 (249.8 pips above) remains distant. The RSI at 20.7 signals extreme oversold conditions, but without a bullish catalyst, this may merely precede consolidation rather than reversal. Today’s pivot at 1.3265 (65 pips above) aligns with the descending 20-day resistance, reinforcing it as a ceiling for any rebound.
Short-term, the path of least resistance remains downward, with a break below 1.3192 likely accelerating losses toward 1.3177 and the 20-day dynamic support at 1.3105. A close above the 20-day resistance at 1.3291 would be needed to invalidate the downtrend — unlikely without a fundamental shift. Watch US session liquidity for potential volatility spikes.
Disclaimer
The content on MarketsFN.com is provided for educational and informational purposes only and does not constitute financial advice. All investments involve risk and past performance does not guarantee future results.