USD/JPY: Up 0.09% to 160.35 — Ascending Channel
MarketsFN Team
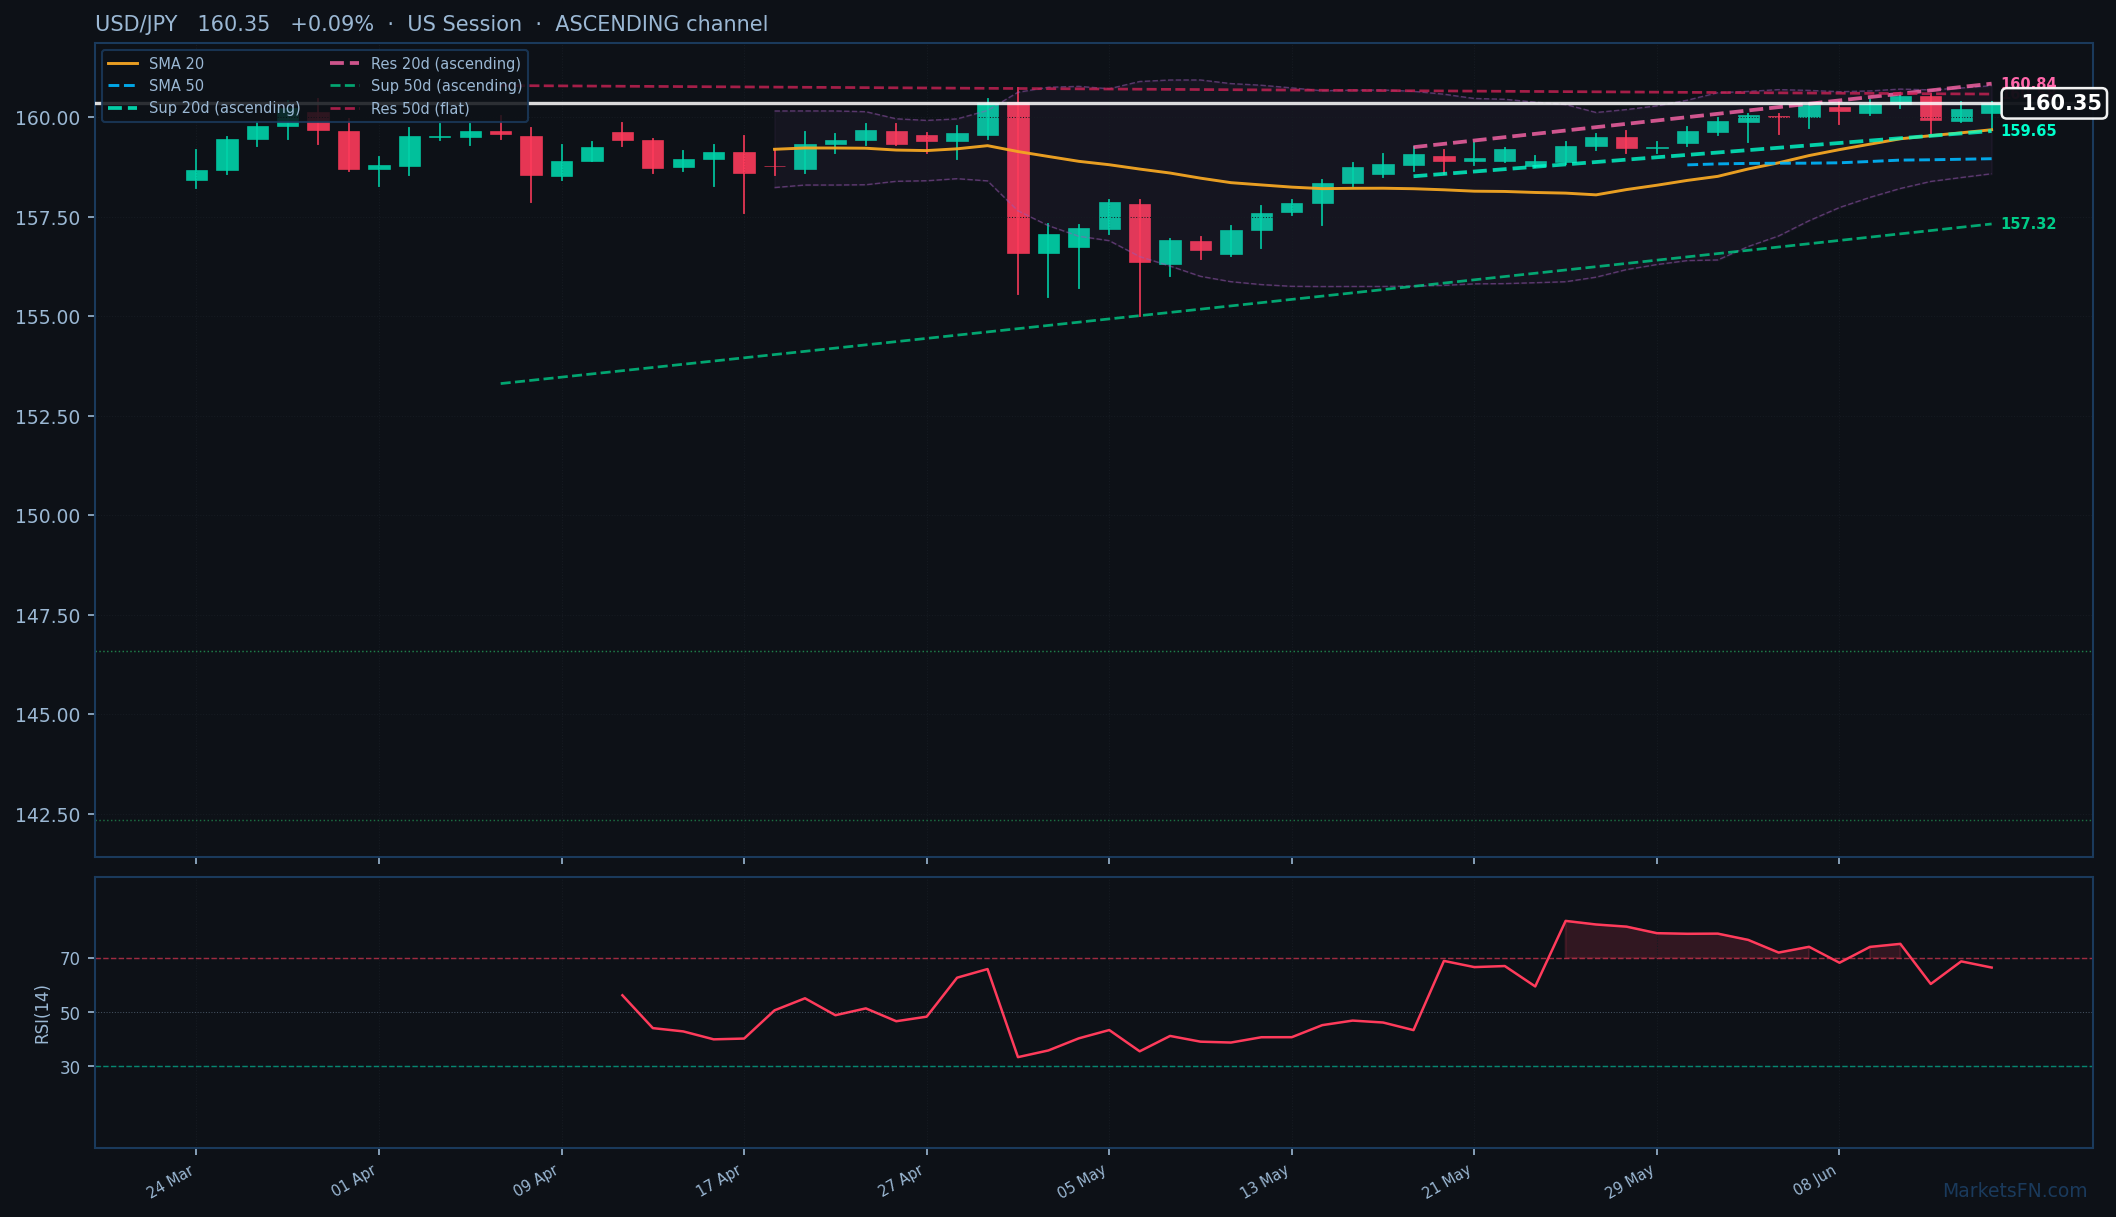
USD/JPY: Up 0.09% to 160.35 — Ascending Channel
Published: June 15, 2026 · MarketsFN Team · US Session
| Pair | Rate | Change | RSI(14) | SMA-20 | SMA-50 | 52W High | 52W Low | Pivot | R1 | S1 |
|---|---|---|---|---|---|---|---|---|---|---|
| USD/JPY | 160.35 | +0.09% | 66.4 | 159.68 | 158.96 | 160.54 | 143.37 | 160.15 | 160.43 | 159.92 |
📊 Support & Resistance Levels
Dynamic Trendlines
| Level | Type | Direction | Distance |
|---|---|---|---|
| 159.65 | 20d Support | ↗ ascending | -0.43% / 69.6 pips |
| 160.84 | 20d Resistance | ↗ ascending | +0.31% / 49.5 pips |
| 157.32 | 50d Support | ↗ ascending | -1.89% / 303.0 pips |
| 160.58 | 50d Resistance | → flat | +0.15% / 23.3 pips |
Static Levels
| Level | Type | Touches | Distance |
|---|---|---|---|
| 146.59 | Support | 3× | -8.58% / 1376.0 pips |
| 142.35 | Support | 2× | -11.22% / 1799.7 pips |
USD/JPY is trading at 160.35 (+0.09%), testing the upper bounds of its 52-week range (143.37–160.54) as the pair consolidates near its all-time high. The uptrend remains firmly intact, with price action holding above both the 20-day SMA (159.68) and 50-day SMA (158.96), confirming bullish momentum. The 20-day dynamic channel is ascending, with immediate support at 159.65 (-69.6 pips) and resistance at 160.84 (+49.5 pips). The 50-day channel also slopes upward, though its resistance at 160.58 (+23.3 pips) is nearly flat, creating a potential inflection point.
Static levels show the nearest pivot resistance (R1) at 160.43 (+8 pips), which aligns closely with today’s high of 160.39, while support (S1) sits at 159.92 (-43 pips). The RSI at 66.4 suggests neutral territory, avoiding overbought conditions despite the extended rally. With ATR(14) at 0.53, today’s range of 159.73–160.39 is typical, though a break above 160.43 could trigger momentum buying toward the 52-week high of 160.54.
The short-term outlook favors continuation, but traders should watch for rejection at 160.43–160.58, where static and dynamic resistances converge. A confirmed breakout above 160.54 would signal fresh bullish momentum, while failure to hold 159.65 (20-day dynamic support) could prompt profit-taking. The next catalyst is the Bank of Japan’s policy meeting later this week—any hint of intervention could disrupt the technical setup.
Disclaimer
The content on MarketsFN.com is provided for educational and informational purposes only and does not constitute financial advice. All investments involve risk and past performance does not guarantee future results.


