USD/JPY: Up 0.09% to 157.50 — RSI Overbought
MarketsFN Team
USD/JPY: Up 0.09% to 157.50 — RSI Overbought
Published: September 29, 2026 · MarketsFN Team · US Session
| Pair | Rate | Change | RSI(14) | SMA-20 | SMA-50 | 52W High | 52W Low | Pivot | R1 | S1 |
|---|---|---|---|---|---|---|---|---|---|---|
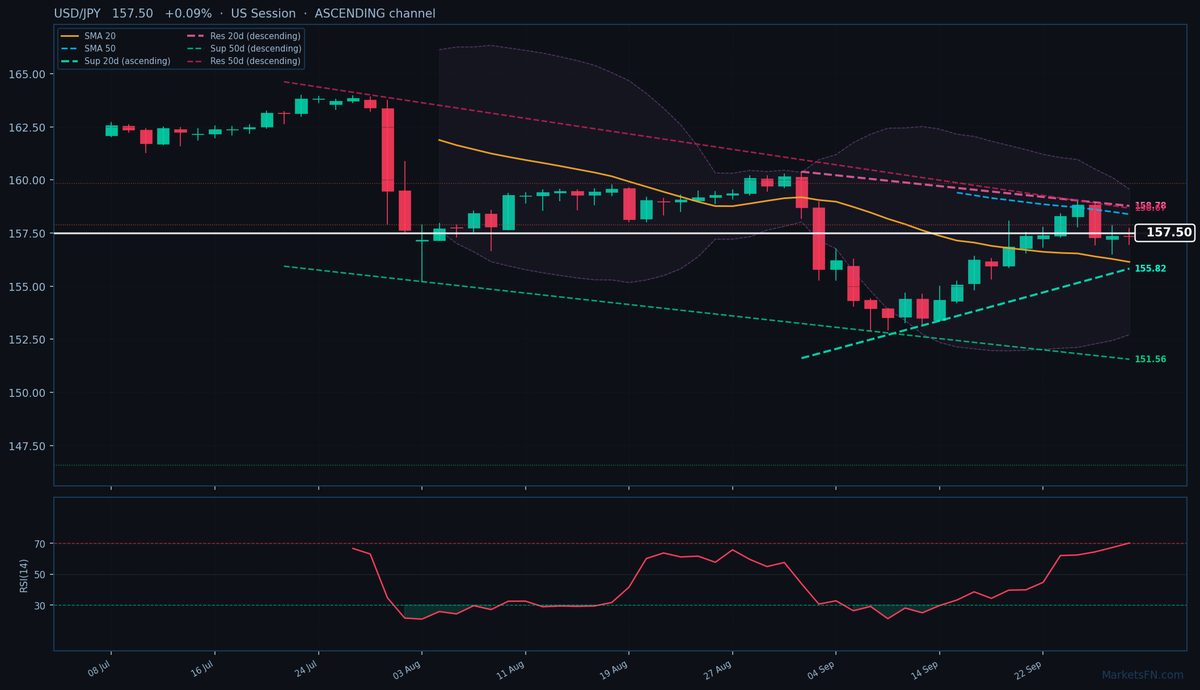
| USD/JPY | 157.50 | +0.09% | 70.3 | 156.14 | 158.38 | 163.84 | 150.41 | 157.24 | 157.98 | 156.63 |
📊 Support & Resistance Levels
Dynamic Trendlines
| Level | Type | Direction | Distance |
|---|---|---|---|
| 155.82 | 20d Support | ↗ ascending | -1.07% / 168.1 pips |
| 158.78 | 20d Resistance | ↘ descending | +0.81% / 127.1 pips |
| 151.56 | 50d Support | ↘ descending | -3.78% / 594.9 pips |
| 158.67 | 50d Resistance | ↘ descending | +0.74% / 116.6 pips |
Static Levels
| Level | Type | Touches | Distance |
|---|---|---|---|
| 159.85 | Resistance | 2× | +1.58% / 248.8 pips |
| 157.91 | Resistance | 2× | +0.35% / 54.9 pips |
| 146.58 | Support | 2× | -6.85% / 1078.2 pips |
USD/JPY is trading at 157.50 (+0.09%), caught in a consolidation phase between its 20-day SMA (156.14, support) and 50-day SMA (158.38, resistance). The pair is testing the upper bounds of its 20-day ascending channel (dynamic support at 155.82, 168.1 pips below) while facing descending resistance from both the 20-day (158.78, 127.1 pips above) and 50-day (158.67, 116.6 pips above) dynamic trendlines. This compression suggests a potential breakout is brewing, with the 50-day channel’s descending slope conflicting with the shorter-term ascending momentum.
Static levels highlight immediate resistance at R1 (157.91, 54.9 pips away), which aligns closely with the descending dynamic resistance cluster near 158.67-158.78. Support is distant at S1 (146.58, 1078.2 pips below), rendering it irrelevant for near-term trading — the dynamic 20-day support at 155.82 is the critical floor. The RSI at 70.3 signals overbought conditions, but the lack of decisive rejection at current levels suggests momentum could persist if USD bulls breach the 158.38 SMA-50 resistance.
Short-term, the pair’s ability to hold above the 20-day SMA and pivot (157.24) favors upside, but the descending 50-day resistance and overbought RSI warrant caution. A close above 158.38 would confirm bullish continuation toward 159.85 (248.8 pips above), while failure below 156.14 (SMA-20) would expose the dynamic support at 155.82. Watch today’s US session for volatility around the 157.91 static resistance level.
Disclaimer
The content on MarketsFN.com is provided for educational and informational purposes only and does not constitute financial advice. All investments involve risk and past performance does not guarantee future results.