NZD/USD: Down 0.61% to 0.5630 — RSI Oversold
MarketsFN Team
NZD/USD: Down 0.61% to 0.5630 — RSI Oversold
Published: September 29, 2026 · MarketsFN Team · US Session
| Pair | Rate | Change | RSI(14) | SMA-20 | SMA-50 | 52W High | 52W Low | Pivot | R1 | S1 |
|---|---|---|---|---|---|---|---|---|---|---|
| NZD/USD | 0.5630 | -0.61% | 17.4 | 0.5760 | 0.5832 | 0.6075 | 0.5581 | 0.5666 | 0.5685 | 0.5647 |
📊 Support & Resistance Levels
Dynamic Trendlines
| Level | Type | Direction | Distance |
|---|---|---|---|
| 0.5615 | 20d Support | ↘ descending | -0.26% / 14.9 pips |
| 0.5681 | 20d Resistance | ↘ descending | +0.90% / 50.6 pips |
| 0.5640 | 50d Support | ↘ descending | +0.18% / 9.9 pips |
| 0.5900 | 50d Resistance | ↘ descending | +4.79% / 269.7 pips |
Static Levels
| Level | Type | Touches | Distance |
|---|---|---|---|
| 0.5994 | Resistance | 2× | +6.26% / 353.0 pips |
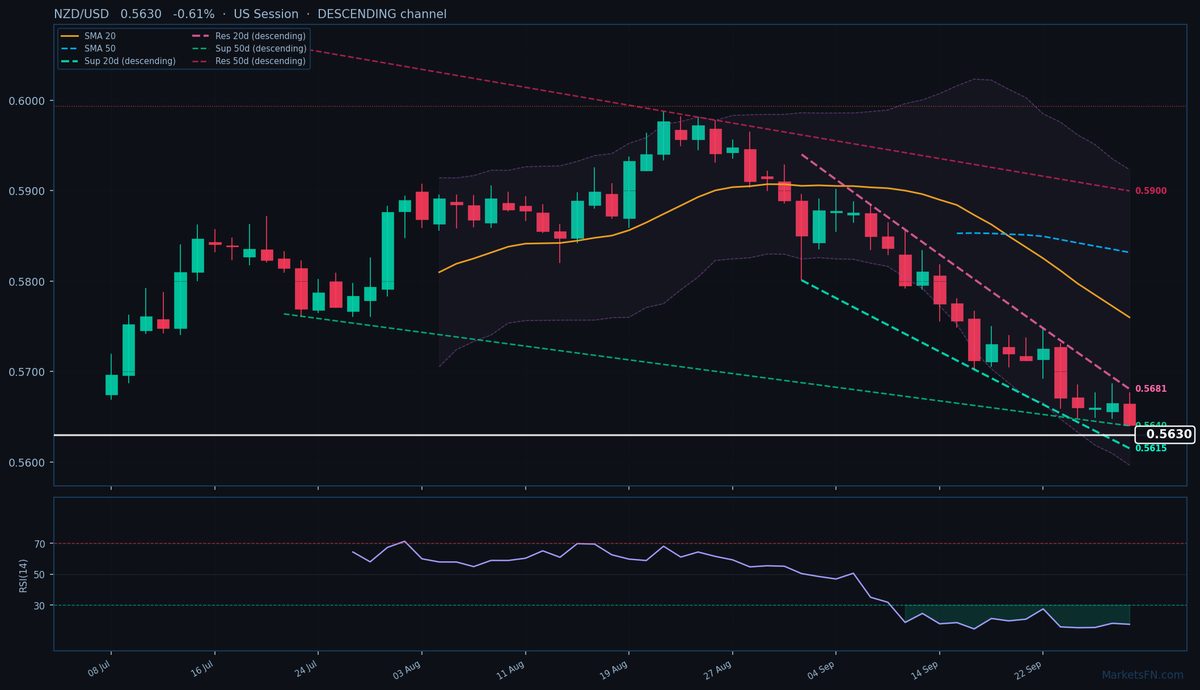
NZD/USD is trading at 0.5630 (-0.61%), extending its downtrend as the pair remains firmly below both the 20-day SMA (0.5760, -130 pips) and 50-day SMA (0.5832, -202 pips). The rate is now testing the lower bounds of its descending 20-day dynamic channel, with immediate dynamic support at 0.5615 (-15 pips) and resistance at 0.5681 (+51 pips). The broader 50-day channel confirms the bearish structure, with resistance far overhead at 0.5900 (+270 pips) and near-term static support at S1 (0.5647, +17 pips) barely holding after today’s breakdown.
Momentum is severely oversold with RSI(14) at 17.4, but the absence of bullish reversal patterns and the descending channel slope suggest this extreme reading may persist. The pair’s failure to reclaim the 20-day dynamic resistance (0.5681) during today’s US session reinforces downside bias, with the 52-week low (0.5581, -49 pips) now in play.
Short-term, watch for a potential bounce off 20-day dynamic support (0.5615), but any rally would face layered resistance at S1 (0.5647), the 50-day dynamic support-turned-resistance (0.5640), and the 20-day dynamic resistance (0.5681). A confirmed break below 0.5615 opens the path to test the 2026 low. The catalyst for reversal would require a close above the 20-day SMA (0.5760), which would break the descending channel’s rhythm. Until then, sellers remain in control.
Disclaimer
The content on MarketsFN.com is provided for educational and informational purposes only and does not constitute financial advice. All investments involve risk and past performance does not guarantee future results.