USD/JPY: Up 0.04% to 157.34 — Ascending Channel
MarketsFN Team
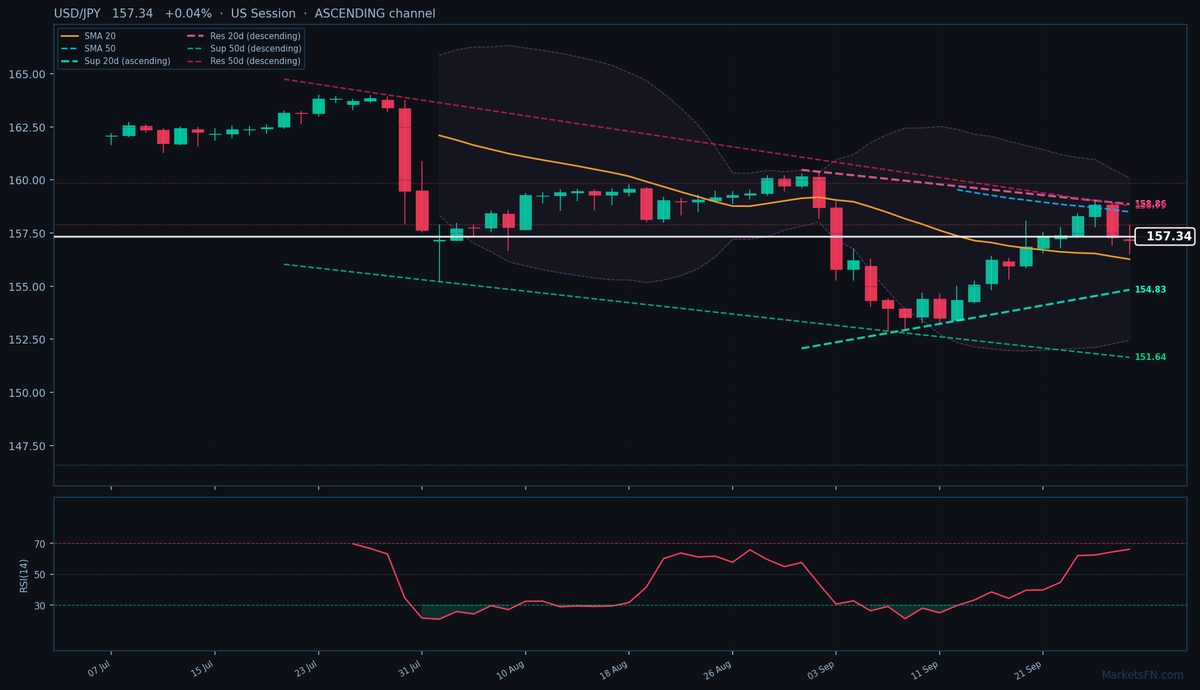
USD/JPY: Up 0.04% to 157.34 — Ascending Channel
Published: September 28, 2026 · MarketsFN Team · US Session
| Pair | Rate | Change | RSI(14) | SMA-20 | SMA-50 | 52W High | 52W Low | Pivot | R1 | S1 |
|---|---|---|---|---|---|---|---|---|---|---|
| USD/JPY | 157.34 | +0.04% | 66.2 | 156.27 | 158.50 | 163.84 | 150.41 | 157.71 | 158.48 | 156.50 |
📊 Support & Resistance Levels
Dynamic Trendlines
| Level | Type | Direction | Distance |
|---|---|---|---|
| 154.83 | 20d Support | ↗ ascending | -1.60% / 251.0 pips |
| 158.86 | 20d Resistance | ↘ descending | +0.97% / 152.4 pips |
| 151.64 | 50d Support | ↘ descending | -3.62% / 569.2 pips |
| 158.79 | 50d Resistance | ↘ descending | +0.92% / 145.5 pips |
Static Levels
| Level | Type | Touches | Distance |
|---|---|---|---|
| 159.85 | Resistance | 2× | +1.71% / 268.8 pips |
| 157.91 | Resistance | 2× | +0.48% / 74.9 pips |
| 146.58 | Support | 2× | -6.73% / 1058.3 pips |
USD/JPY is trading at 157.34 (+0.04%), trapped in a consolidation phase between the 20-day SMA (156.27, support) and 50-day SMA (158.50, resistance). The rate is currently 1.23 pips below the 50-day SMA, signaling indecision as it oscillates between these key moving averages. The 20-day dynamic channel remains ascending, with immediate support at 154.83 (251.0 pips below) and resistance at 158.86 (152.4 pips above), while the broader 50-day channel is descending, reflecting longer-term bearish pressure with resistance at 158.79 (145.5 pips above).
Static levels reveal a congested near-term range: R1 at 157.91 (74.9 pips above) has been tested twice, while S1 at 146.58 (1058.3 pips below) is too distant to matter for tactical trading. The RSI at 66.2 sits in neutral territory, neither overbought nor oversold, suggesting room for further consolidation or a breakout attempt. With the ATR at 1.34, today’s range of 156.50–157.85 aligns with typical volatility, though a close above 157.71 (pivot) could signal bullish momentum toward R1.
The short-term outlook hinges on whether USD/JPY can reclaim the 50-day SMA (158.50). Failure here would reinforce the descending 50-day channel and likely retest 20-day support (156.27). Watch for US session momentum—a break above 157.85 (today’s high) would target R1, while a drop below 156.50 (today’s low) risks a slide toward the 20-day SMA. The next catalyst is Friday’s US PCE data, which could break the stalemate.
Disclaimer
The content on MarketsFN.com is provided for educational and informational purposes only and does not constitute financial advice. All investments involve risk and past performance does not guarantee future results.